


FXOpen
Understanding the nuances of order imbalances is key for traders looking to navigate the ebb and flow of asset prices. Order imbalances provide a clear window into the supply and demand dynamics at play, offering strategic insights. This article delves into the intricacies of order imbalances, their causes, and a practical strategy for leveraging these market phenomena.
Understanding Order Imbalances
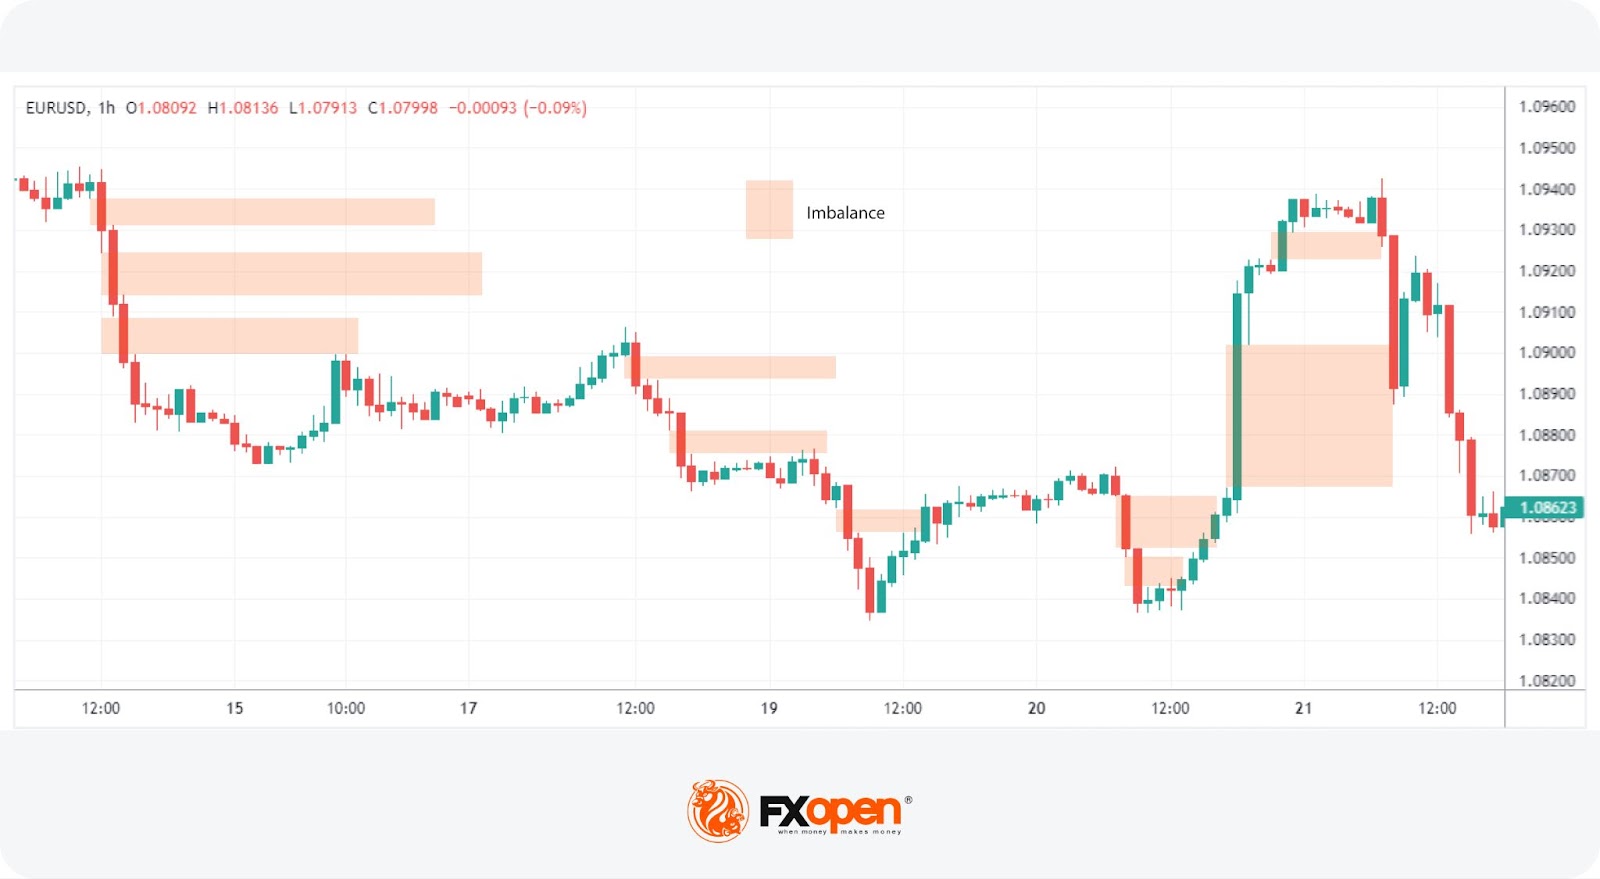
Order imbalance, a fundamental concept in forex, crypto*, commodity, and stock markets, refers to a situation where there is a disproportionate number of buy or sell orders for a particular asset. This imbalance of orders can significantly influence asset prices, pushing them up or down depending on the direction of the imbalance. Known also as fair value gaps, they offer a window into the underlying supply and demand dynamics shaping the market at any given moment.
A market imbalance occurs when there's an overwhelming interest from buyers (buy-side imbalance) or sellers (sell-side imbalance) without enough opposite-side orders to match. This scenario typically reflects the market participants' consensus about the asset's future direction.
These imbalances are critical components of the Smart Money Concept (SMC), a trading framework that focuses on understanding the actions of institutional investors. SMC proponents argue that by analysing where and how these imbalances occur, traders can align their strategies with those of the market's most influential players. The rationale is that institutional movements, often the cause behind significant imbalances, have the power to drive market trends.
The Role of Imbalances in Trading
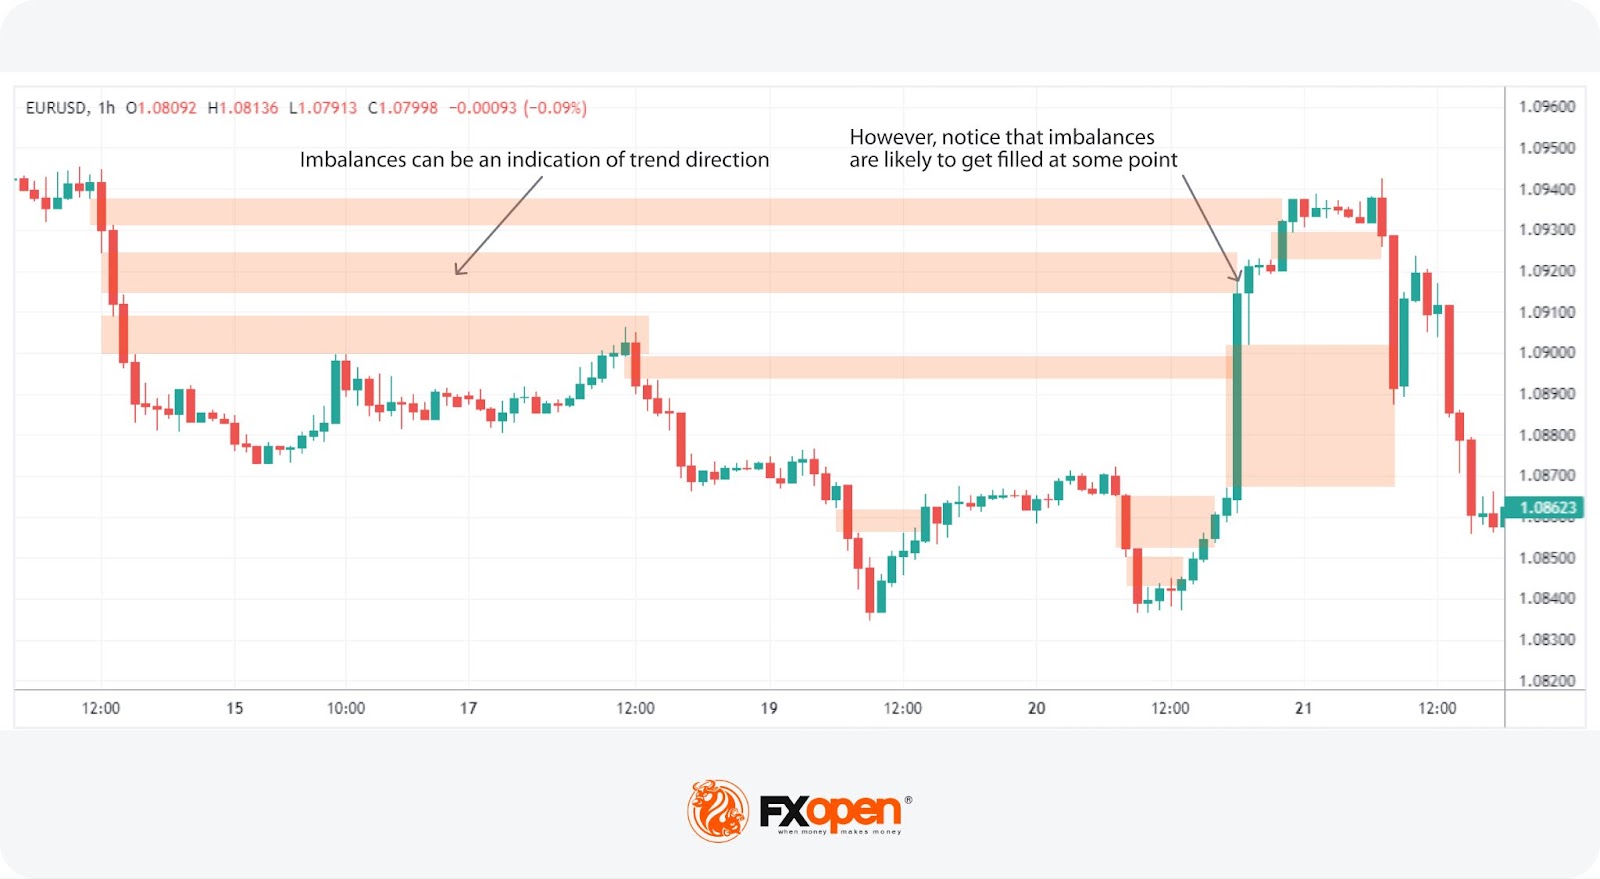
Traders often use imbalances to gauge market sentiment and direction. Large imbalances indicate a pronounced market preference for either buying or selling, suggesting that the trend in the direction of the imbalance is likely to persist. This directional insight is particularly potent with substantial imbalances (also known as liquidity voids), whereas smaller ones may be less effective for market analysis.
Moreover, imbalances serve as a critical tool for identifying potential entry points. The market often seeks to "fill" these gaps, created by a lack of trading volume (and therefore a lack of liquidity) in a price range, pulling prices back to these zones before typically continuing the trend.
This phenomenon, akin to gap trading, hinges on the concept that prices gravitate towards areas of minimal resistance, which, in this case, are the imbalance zones. Recognising these zones allows traders to anticipate possible price movements towards these magnet-like areas, offering potential entries based on the principles of supply and demand imbalance.
Identifying Imbalances on a Chart
In imbalance trading, the areas of interest are identifiable through a specific three-candle pattern. The central candle, or the second in the sequence, represents an impulse move in any direction, flanked by two candles that form the zone's boundaries. This pattern, finalised once the third candle closes, signals an imbalance, suggesting rapid price movement through levels without consolidation.
These patterns often resemble engulfing candles, indicating swift price movements through different levels. For trading imbalances effectively, it’s crucial to note that the most significant imbalances manifest as sharp movements on both higher and lower timeframes. If they came after a liquidity sweep (a bull or bear trap), then this also adds confluence.
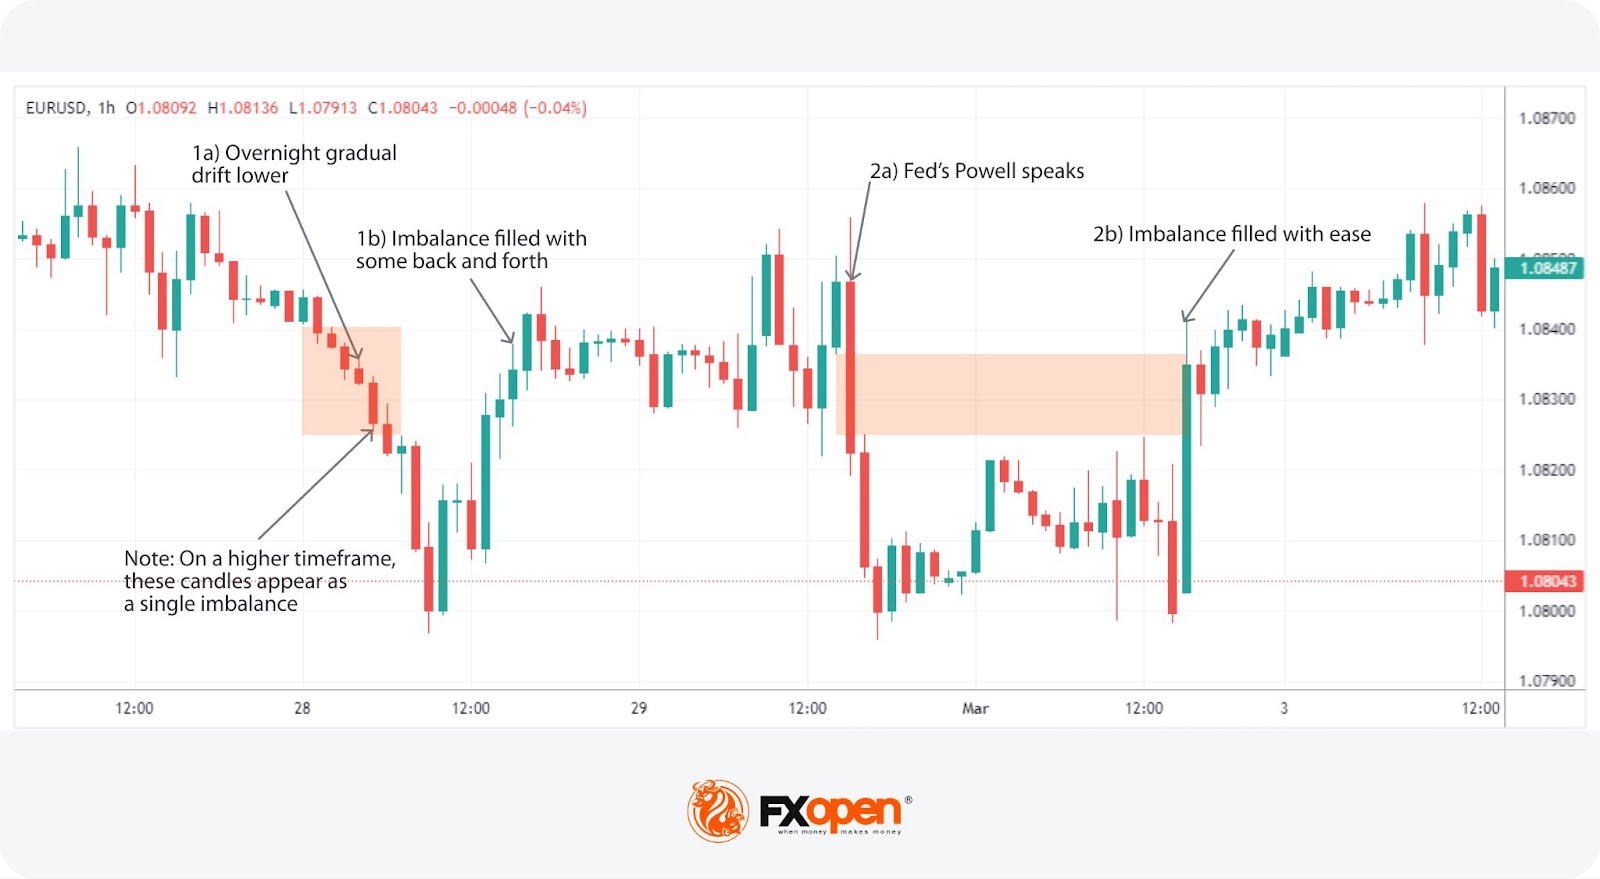
An imbalance appearing as one sharp move on a higher timeframe but more gradual on a lower one still counts as an imbalance, but it may not be traded through as easily as one where the sharpness is consistent across timeframes (e.g., after a significant news announcement).
Similarly, while multiple imbalances may exist on a lower timeframe in a given price movement (given that an imbalance is a simple three-candle pattern), they may appear as just a single imbalance on a higher timeframe. For the sake of simplicity, it may be easier to draw the higher timeframe imbalance as an area of interest vs multiple imbalances on lower timeframes.
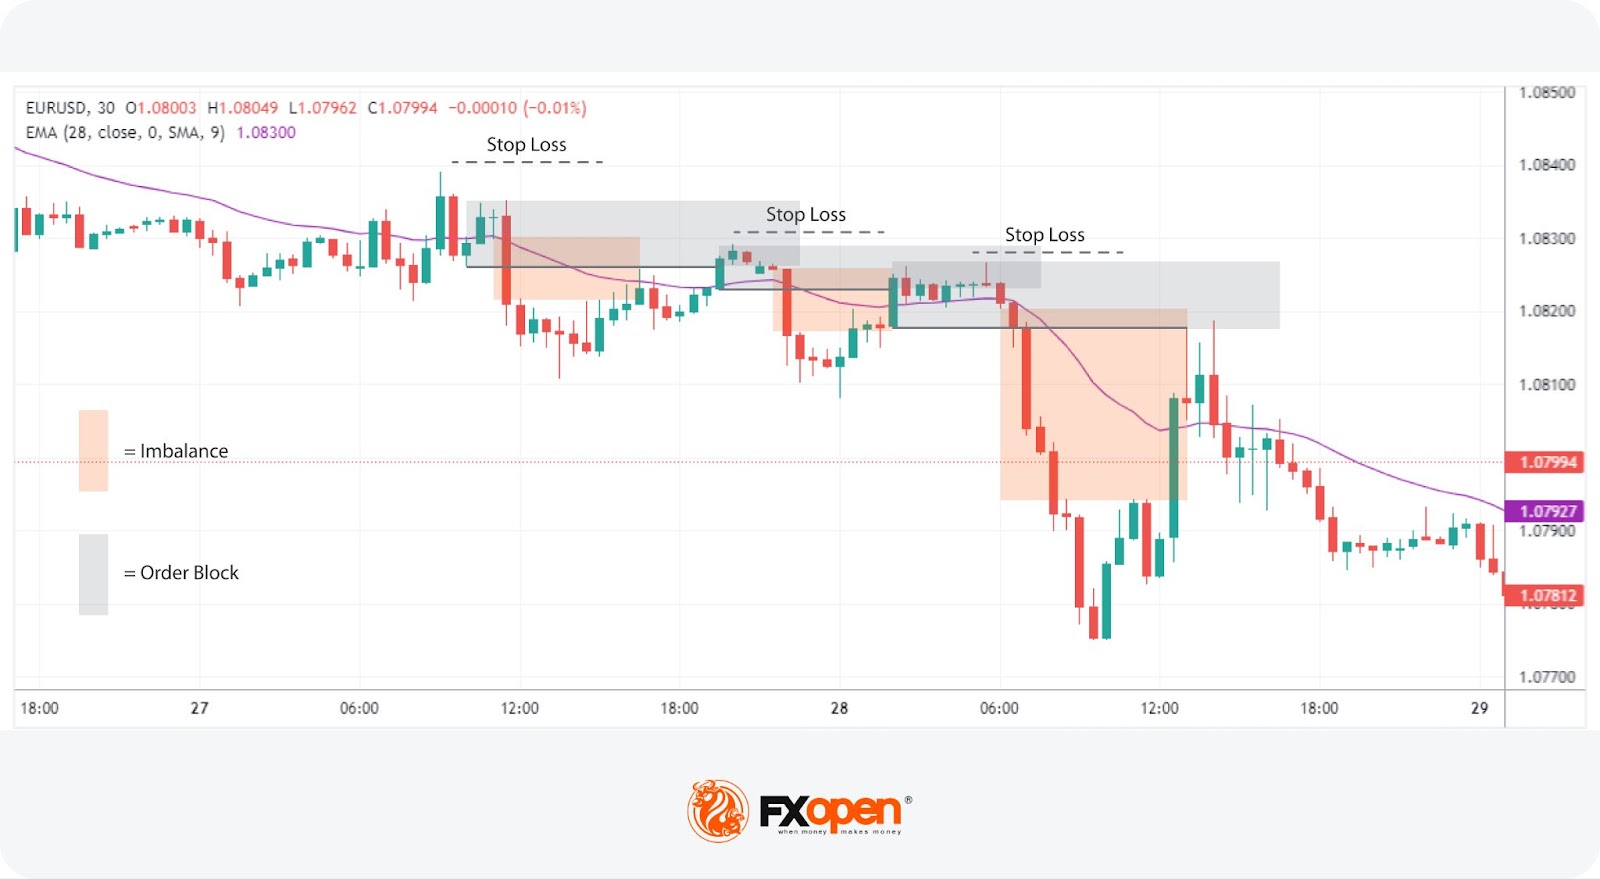
Trading Imbalances and Order Blocks: A Strategy
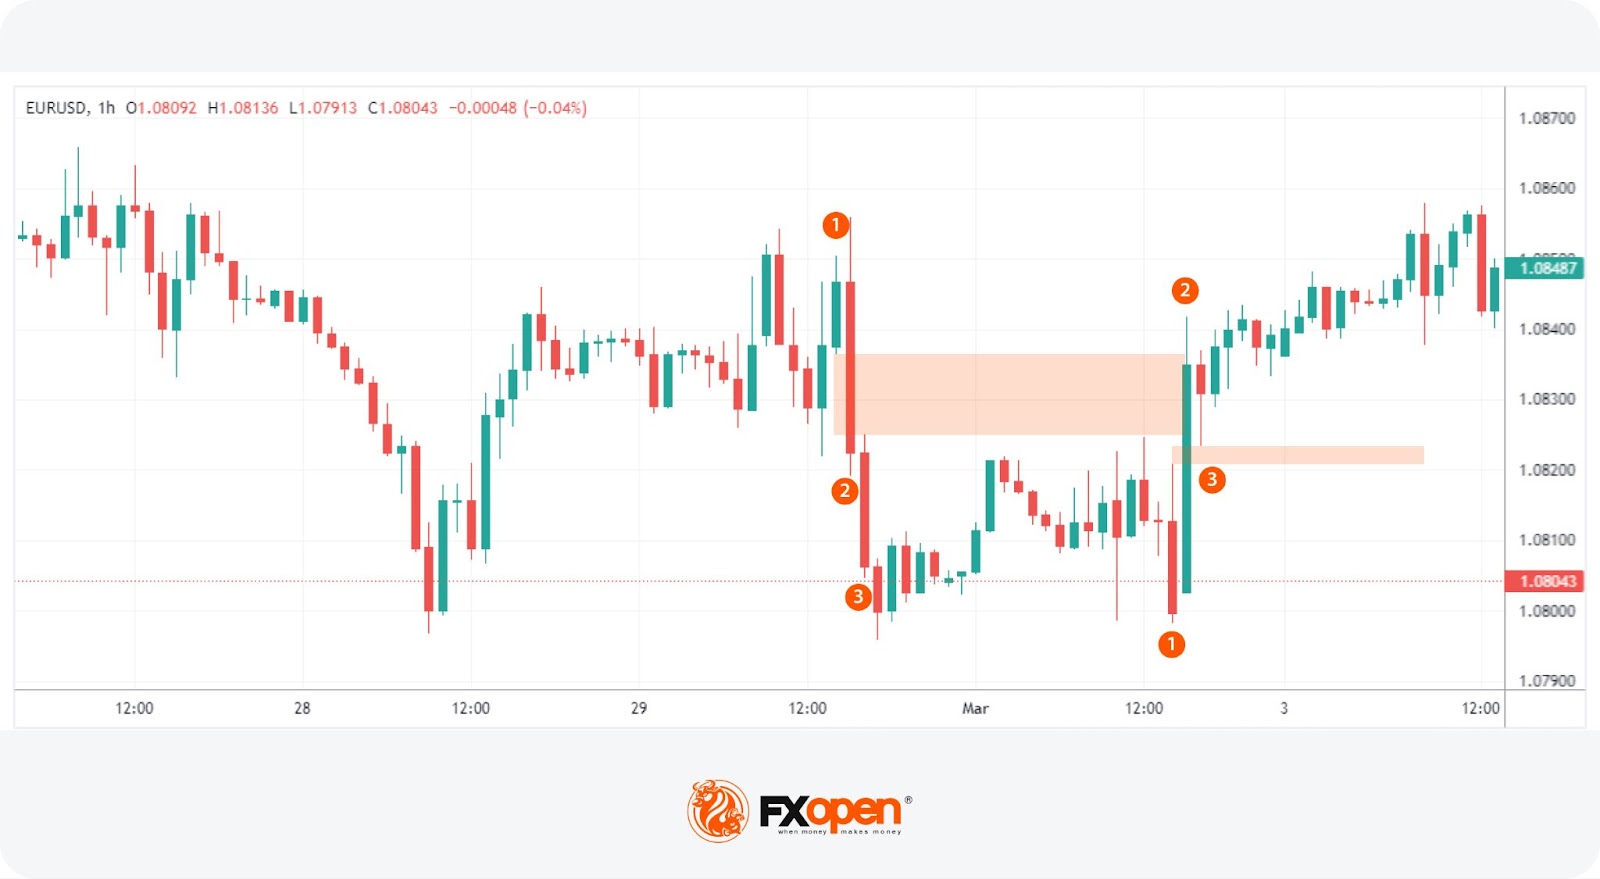
In an imbalance trading strategy, it’s best to stick with the prevailing market trend. By combining trend analysis with imbalance identification, traders can align themselves with the market's momentum and identify valuable setups.
In SMC, traders usually identify trends by examining market structure (higher highs/higher lows and vice versa) and breaks of this structure. We’ll use a 28-period Exponential Moving Average (EMA) for straightforward trend identification here. A downward-sloping EMA typically indicates a bearish trend, while an upward slope reflects bullish conditions.
When trading imbalances, those that lead to the creation of new highs or lows in line with the trend are usually targeted. As mentioned earlier, there’s a notable probability that the price may come to fill the imbalance before continuing the trend.
Specifically, they look for the last significant countertrend movement, usually in the form of one or two strong candles. This concept dovetails with the SMC principle of order blocks, and is effectively the last strong countertrend movement before an imbalance.
In other words, traders look for the last strong upward move before a downward move in a bearish trend and vice versa. These blocks often precede imbalances, making them strategic entry points for traders looking to capitalise on trend continuation.
Consider following along on live charts in FXOpen’s free TickTrader platform for the deepest understanding.
Entry
- Traders identify the market trend using the slope of an EMA in this scenario.
- They look for an imbalance that results in a new high or low in line with the identified trend.
- The entry point may be set at the high (bullish trend) or low (bearish trend) of the last strong counter-trend candle before the imbalance, aligning with the concept of order blocks.
Stop Loss
- A stop loss may be set just beyond the order block, providing a potential safeguard against reversals.
Take Profit
- Profit-taking strategies may involve waiting for the price to fill another imbalance or reaching a predetermined technical level.
- To maximise returns while following the trend, traders could employ trailing stops above or below new swing points or follow a longer-term moving average as a dynamic exit guide.
Causes of Order Imbalances
Trade imbalances usually arise from key factors directly impacting market dynamics. High-impact news releases and economic events can quickly skew the balance as traders react en masse to new information, either flooding the market with buy orders or triggering a sell-off. Institutional orders, due to their sheer volume, also create imbalances by outpacing the market's ability to absorb them, sharply moving prices in one direction.
Shifts in market sentiment, driven by broader economic indicators or trending market narratives, can collectively tilt trading activity towards buying or selling, further contributing to order flow imbalances. Additionally, technical factors, such as prices reaching critical support or resistance levels, can activate automated trading algorithms that rapidly buy or sell, exacerbating the imbalance as these systems execute large-scale trades based on pre-set conditions.
The Bottom Line
Mastering the art of identifying and trading order imbalances can be a powerful addition to a trader’s arsenal, offering deep insights into market dynamics. For traders seeking to apply these concepts in real-world scenarios, opening an FXOpen account provides a powerful platform to explore these ideas and take advantage of imbalances with confidence.
FAQs
What Does Imbalance Mean in Trading?
In trading, an imbalance refers to a situation where buy orders significantly outnumber sell orders, or vice versa, leading to potential shifts in asset prices. This disproportion indicates strong market sentiment towards either buying or selling, impacting price movement direction.
What Causes a Trade Imbalance?
Trade imbalances are primarily caused by significant news releases, large institutional orders, shifts in market sentiment, and technical triggers. These factors can lead to a sudden surge in buying or selling activity, creating an imbalance between supply and demand.
What Is an Imbalance Zone?
An imbalance zone is a specific area on a trading chart where the price has moved sharply, creating a gap known as a fair value gap. This gap signifies a period during which trading volume was minimal, suggesting a potential area for price to return to in the future.
What Is the Order Imbalance-Based Strategy?
The order imbalance-based strategy involves identifying moments when buy or sell orders dominate and using this information to anticipate future price movements. Traders use these imbalances to inform their entry and exit points.
What Is the Difference Between a Fair Value Gap and a Volume Imbalance?
A fair value gap refers to a price area skipped over during rapid market movement, indicating a potential return point for the price. Volume imbalance, however, specifically relates to the difference in volume between buy and sell orders, impacting price direction without necessarily creating a visual gap on the chart.
*At FXOpen UK and FXOpen AU, Cryptocurrency CFDs are only available for trading by those clients categorised as Professional clients under FCA Rules and Professional clients under ASIC Rules, respectively. They are not available for trading by Retail clients.
This article represents the opinion of the Companies operating under the FXOpen brand only. It is not to be construed as an offer, solicitation, or recommendation with respect to products and services provided by the Companies operating under the FXOpen brand, nor is it to be considered financial advice.
Latest from Trader’s Tools
Latest articles

How to Identify and Trade Liquidity Grabs
Understanding the intricacies of market liquidity and the role of liquidity grabs can be crucial for optimising trading strategies. Liquidity grabs, creating rapid price movements, are a key component of Smart Money trading. This article explores how to identify these
What Is a Piercing Line Pattern, and How Can You Trade with It?
In the world of technical analysis, the piercing line pattern stands out as a solid indicator of potential market reversals. This article delves into the nuances of this two-candlestick pattern, exploring its formation, significance, and how traders can effectively leverage
London Calling! FTSE 100 Stocks Flying High Once Again
Back in 2021, which when looking at a physical calendar does not seem such a long time ago yet feels like an epoch ago when considering the changes in global economies and the capital markets since then, the FTSE 100