


FXOpen

In the world of technical analysis, the piercing line pattern stands out as a solid indicator of potential market reversals. This article delves into the nuances of this two-candlestick pattern, exploring its formation, significance, and how traders can effectively leverage it in their trading strategies alongside several examples.
Understanding the Piercing Line Pattern
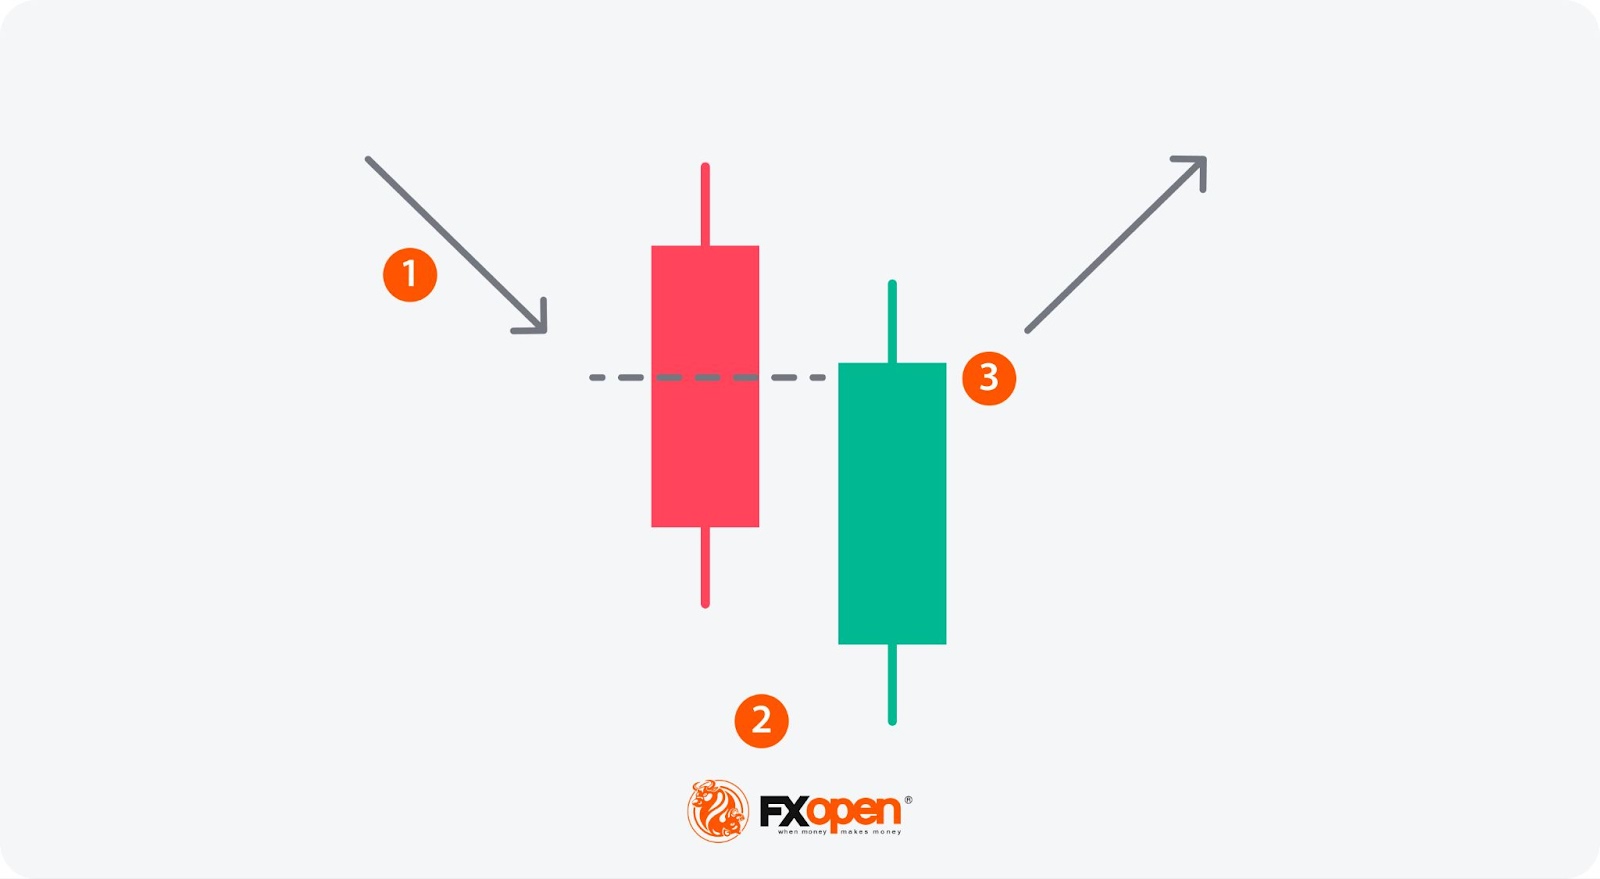
The piercing line pattern, or a piercing pattern, is an important candlestick formation used by traders to identify potential reversals in a down-trending market. This pattern consists of two candlesticks: the first is long and bearish, indicating a strong sell, while the second is long and bullish, indicating a strong buy.
In terms of a piercing definition, the following conditions must be met for the pattern to be valid:
- A downtrend persists, with the first candle being bearish.
- A bullish candle opens below the close of the first candle, signifying a continuation of the initial downward momentum.
- Most importantly, the bullish candle’s close must be above the midpoint of the bearish candle’s body. This indicates a significant shift in market sentiment during the two periods, from initial pessimism to strong buying interest.
This turnaround is critical as it suggests that the sellers who once had control are losing their grip, and buyers are starting to dominate, driving the prices up. The pattern is considered more valid and reliable when it occurs at high volume, as this reflects greater participation and commitment from buyers to sustain higher prices.
While the piercing line candlestick pattern is particularly popular in stock trading due to the prevalence of gaps between the close of one candle and the open of the next, it can also appear in any traded asset, including forex, commodities, and indexes. However, the piercing line often only appears over the weekend in these markets due to their greater liquidity and longer trading windows (vs a stock’s shorter daily trading window).
Note that a bullish piercing pattern is simply known as a piercing pattern; a bearish piercing pattern is known as a dark cloud cover pattern.
Trading the Piercing Line Pattern
The piercing line is a compelling but relatively rare candlestick formation. Given its rarity and potential for false signals, traders use it in conjunction with other analytical tools and market contexts to confirm its validity.
Market Context
When considering the piercing line, traders first evaluate the market's current trend. This pattern is relevant in a downtrend, but the broader market context plays a crucial role.
For instance, if the asset is experiencing a short-term pullback within an overall uptrend, the appearance of a piercing line may signal a continuation of the bullish trend, offering a higher confidence level in the pattern's predictive power. Conversely, in a prolonged downtrend, traders often seek additional confirmation before going long.
Additional Confirmation
In terms of additional confirmation, there are several ways that a trader might gain additional confidence before entering the market.
Support Levels
Identifying this pattern at a known support level typically enhances its use. Support levels represent price points where historical price action has shown a tendency to reverse, making them ideal zones for the pattern to emerge.
Volume Considerations
The volume serves as a secondary confirmation; higher trading volume on the bullish candle suggests strong buyer involvement and commitment, reinforcing the reversal signal. However, the absence of high volume doesn't necessarily invalidate the pattern but calls for a more cautious interpretation.
Momentum Indicators
Tools such as the Awesome Oscillator and the Stochastic Oscillator can provide additional evidence of a reversal. The Stochastic rising above 20 can complement the piercing line pattern, suggesting that the downtrend momentum is waning. Bullish divergences in both indicators can equally confirm the pattern.
These indicators and hundreds of other trading tools can be found in FXOpen’s free TickTrader charting platform.
Following Price Action
Post-pattern price action is also informative. An upward gap, a breakaway gap, or bullish engulfing candles showing sustained upward movement can further validate the reversal signalled by the piercing line.
Entries and Exits
After identifying a piercing on a chart, the final step is to plan entry and exit points.
Entry
Traders might consider entering a position at the close of the bullish candle if enough confirmation is seen, e.g., if the pattern occurs at a support level with significant volume. Alternatively, they may wait to observe the following periods’ price action to confirm that the reversal is underway. Delaying entry can be prudent to ensure that the bullish momentum continues, though may offer a worse risk/reward ratio.
Stop Loss
Setting a stop loss just below the low of the bullish candle in the piercing line pattern is a common practice among traders. If the price drops below this level, it typically indicates that the anticipated reversal has failed, and the downtrend is likely to continue.
Take Profit
Deciding when to take profits depends on the trader's risk tolerance and goals. One approach might be to set a target based on a predetermined risk/reward ratio. Alternatively, traders might aim to exit at the next major resistance level or use a trailing stop loss to maximise returns if the new bullish trend develops as expected.
Piercing Line Pattern Example 1: Amazon
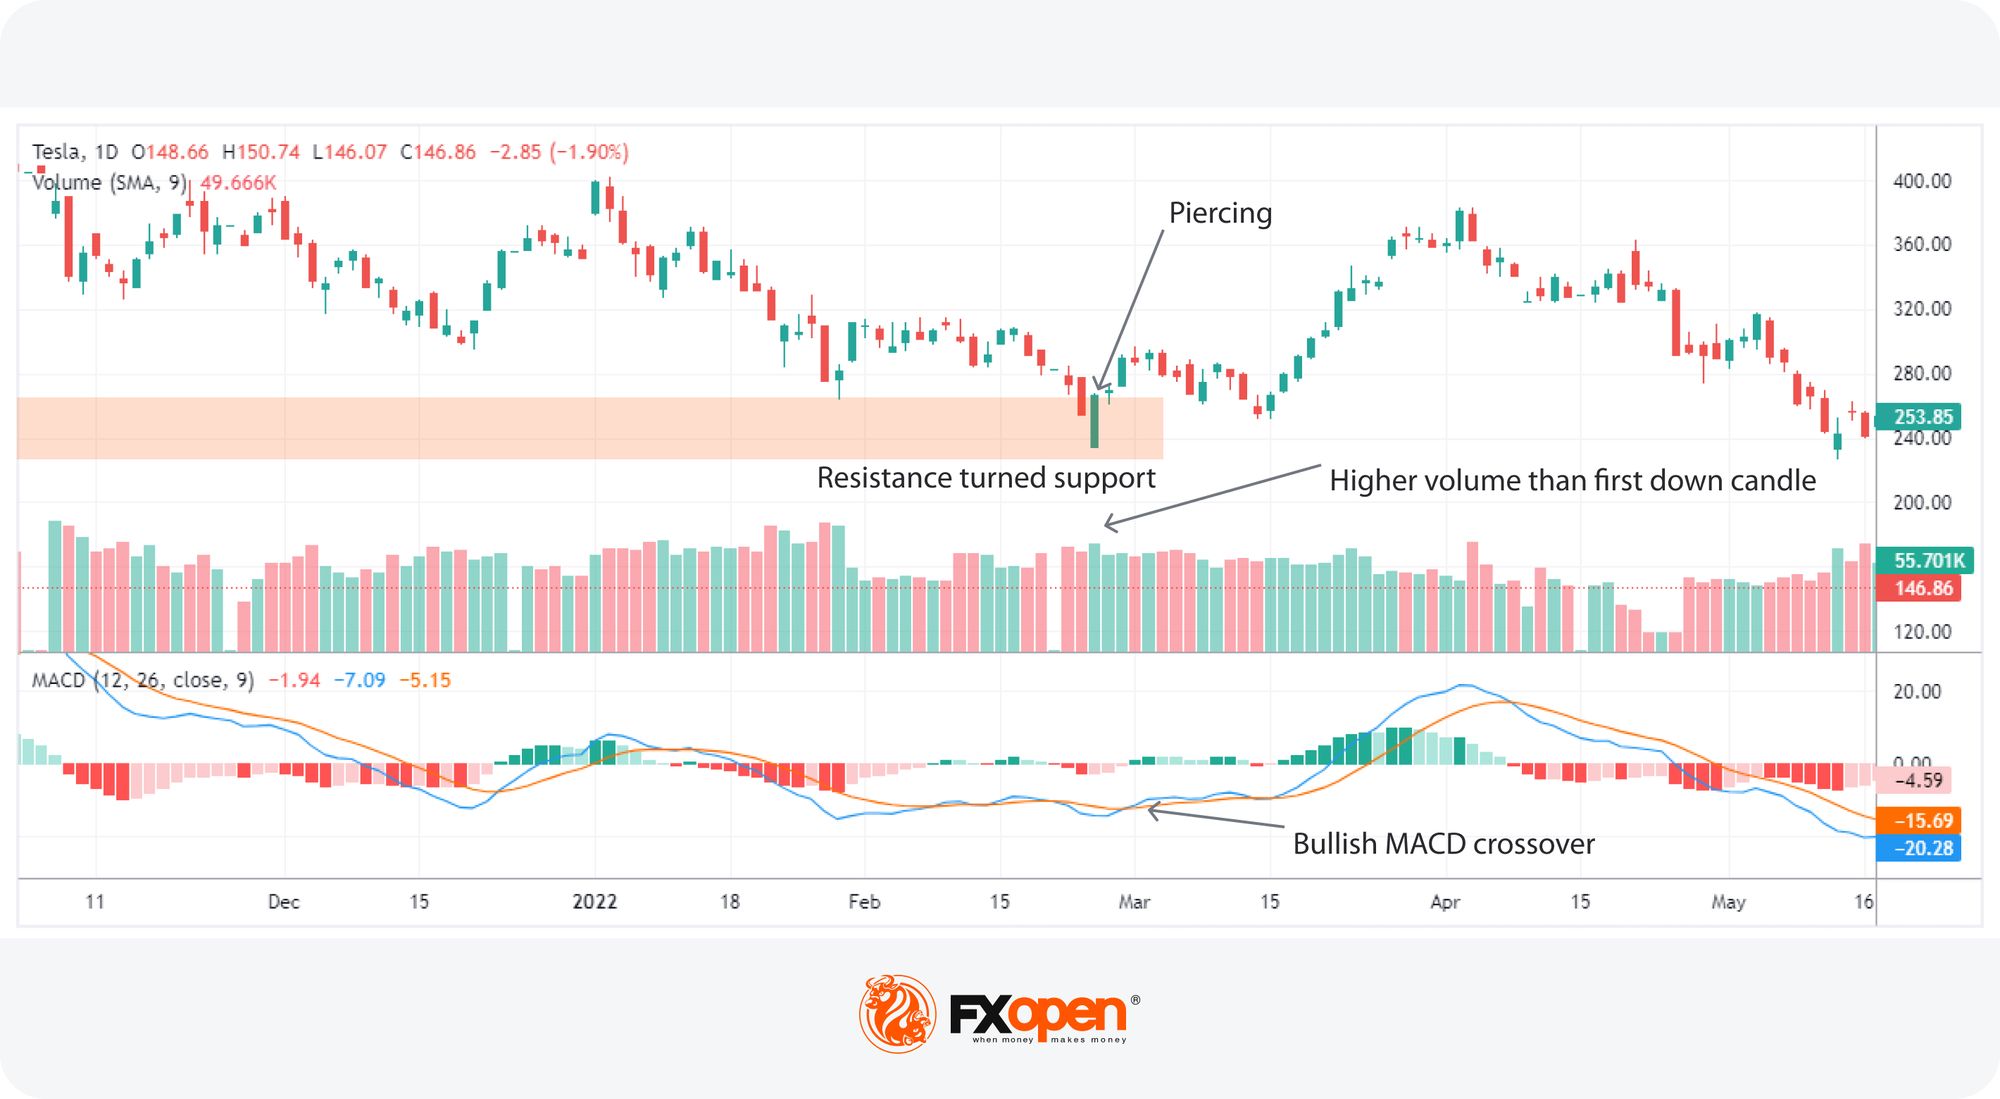
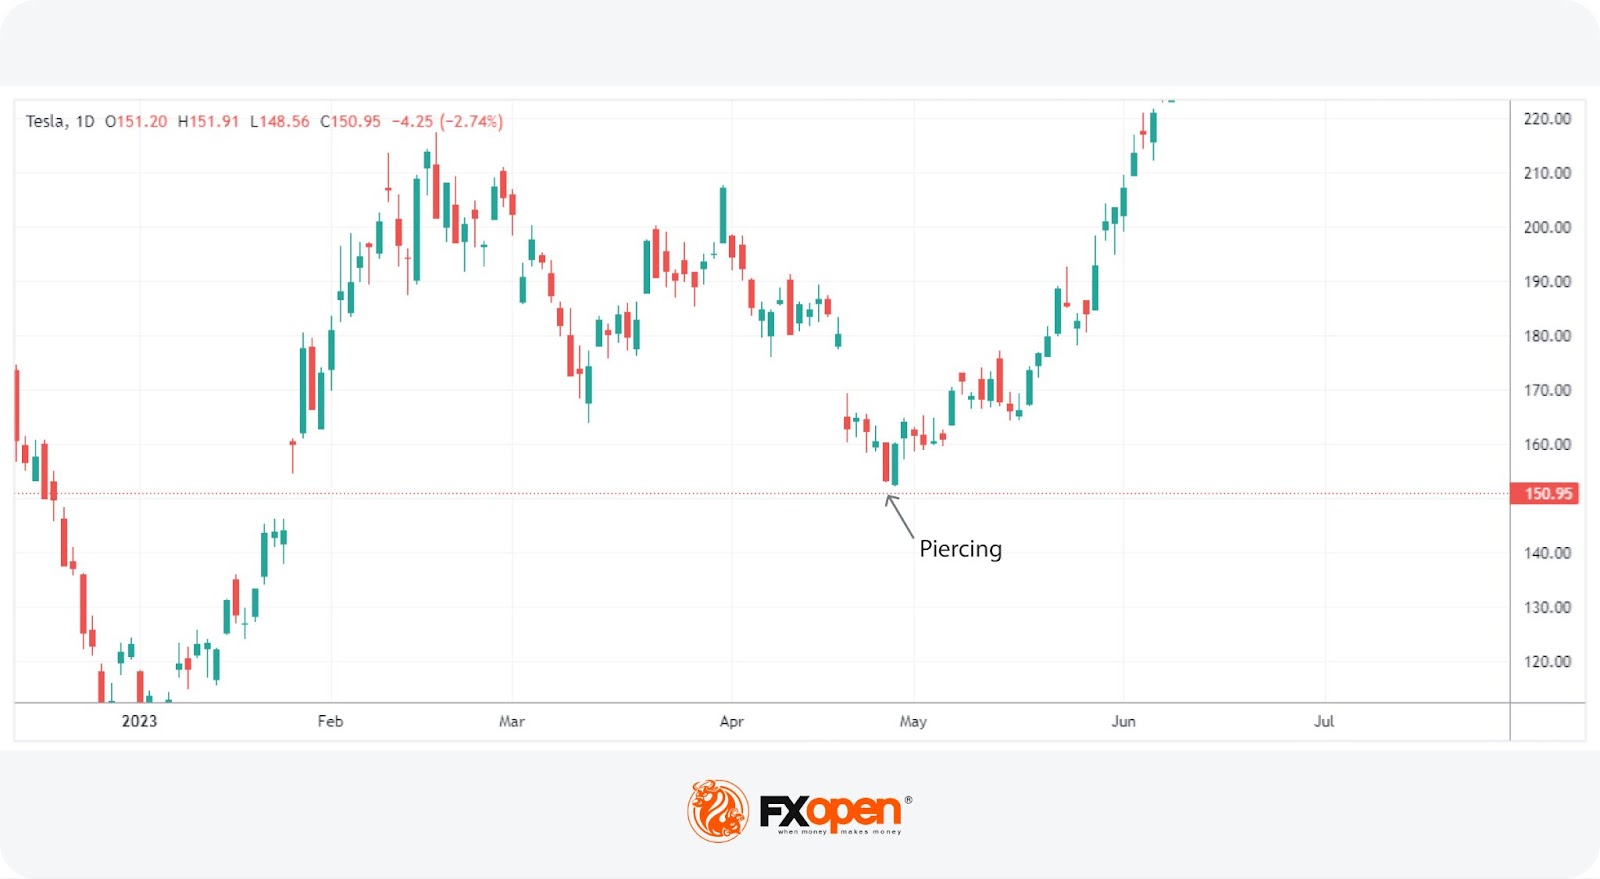
In this example, Tesla (TSLA) stock experiences a pullback after reaching new all-time highs off-screen. The stock retraces to a previous resistance level, which now acts as support. As the price approaches this support area, it closes firmly into it. However, the second candle shows buyers stepping in, with an even stronger bullish candle closing above the midpoint of the first, completing the piercing line pattern. Notably, it does so with a volume higher than that of the preceding bearish candle, signalling strong buying interest.
Concurrently, the MACD indicator reinforces the bullish sentiment with a bullish crossover and divergence, suggesting a weakening of the downtrend. Although the bearish trend resumes later, this setup provides traders with a prime opportunity to capitalise on the temporary bounce off the support level.
Piercing Line Pattern Example 2: JPMorgan Chase
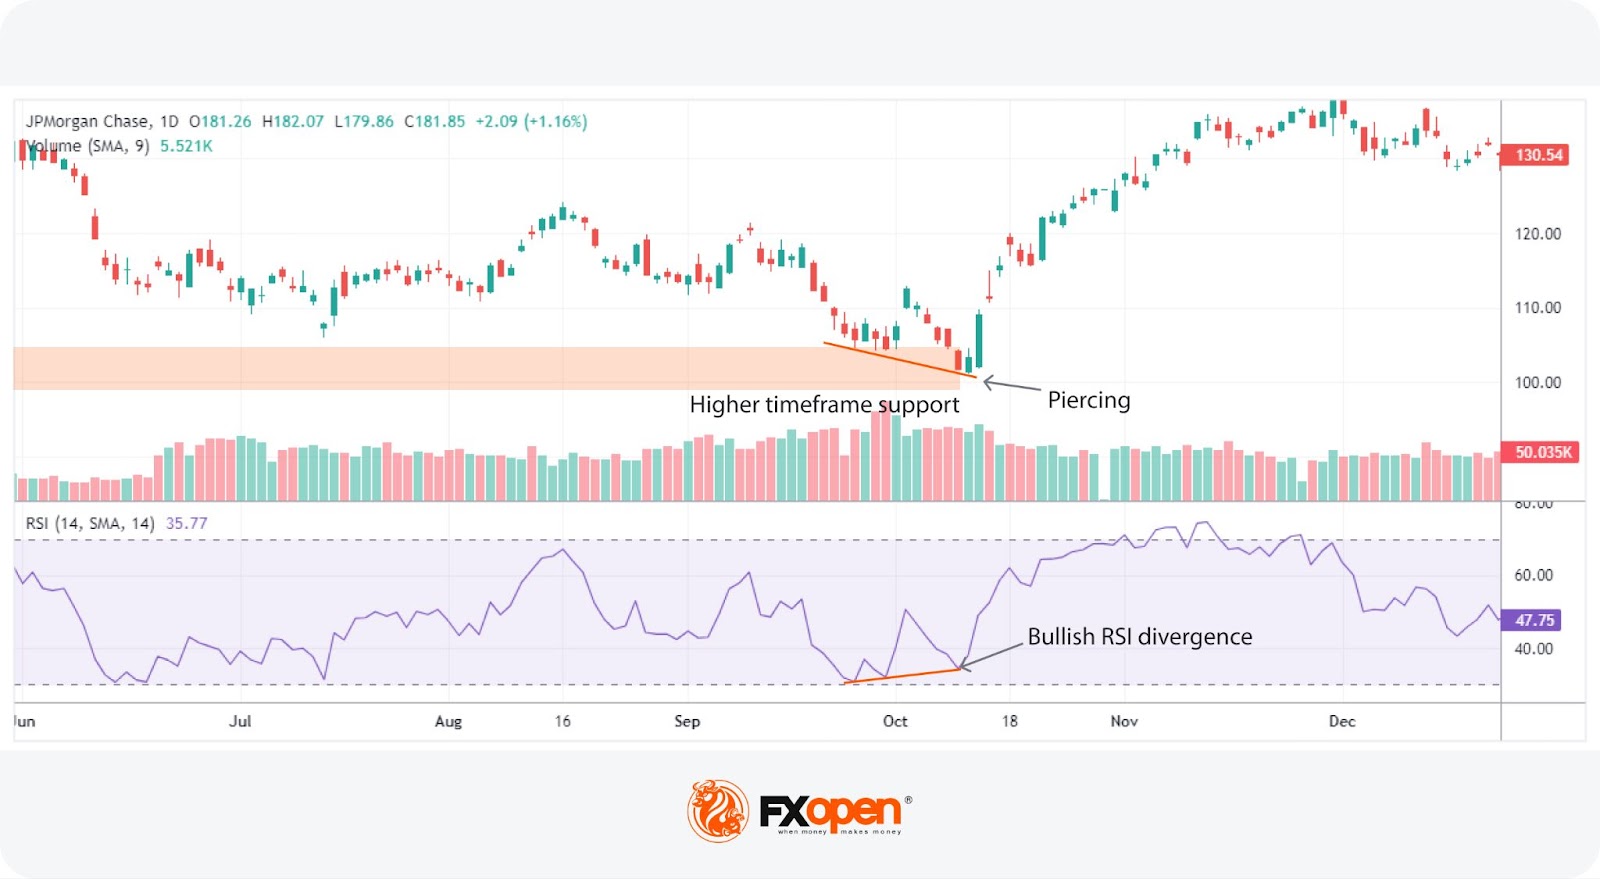
For JPMorgan Chase (JPM), the scenario begins similarly with the stock reaching a higher timeframe support after a prolonged downtrend. The piercing line pattern appears here as well but with a distinct difference: the volume on the bullish candle doesn't notably stand out. However, the formation is supported by a bullish divergence in the RSI, indicating a weakening downward momentum.
The trading day following the pattern's formation becomes pivotal. JPMorgan Chase records its largest single-day bullish movement in four months, manifested in a strong bullish candle on increased volume.
This price action serves as a decent confirmation that the piercing line pattern is functioning as expected, signalling a strong bullish reversal. Such a scenario showcases how multiple technical indicators can align to support the initial signal provided by the pattern.
The Bottom Line
The piercing line pattern offers valuable insights into potential market reversals, serving as a valuable tool for traders who seek to optimise their strategies. By recognising and validating this pattern with supplementary analysis, traders may make more informed decisions. For those looking to apply these strategies in real-time markets, consider opening an FXOpen account to access advanced trading tools and enhance your trading potential.
FAQs
What Is the Piercing Line Pattern?
The piercing line pattern is a bullish reversal candlestick formation observed in a downtrend market. It consists of two candles: the first is a long, bearish candle, and the second is a long and bullish candle that opens below the first's close and closes above its midpoint. This pattern indicates a shift from selling to buying pressure, suggesting a potential upward movement.
How Do You Trade a Piercing Pattern?
Traders often look for a piercing pattern in a downtrend context, particularly at a support level, to signal a potential bullish reversal. It's common to seek additional confirmation through volume, momentum indicators like Awesome Oscillator or Stochastic, and subsequent bullish price actions before initiating a trade. Entry typically occurs after these confirmations, with stop losses set below the bullish candle.
What Is the Opposite of a Piercing Pattern?
The opposite of the piercing pattern is the dark cloud cover pattern, a bearish reversal indicator. It occurs in an uptrend and is characterised by a long bullish candle followed by a bearish candle that opens above the previous candle’s close and closes below its midpoint, signalling increased selling pressure and a potential price decline.
This article represents the opinion of the Companies operating under the FXOpen brand only. It is not to be construed as an offer, solicitation, or recommendation with respect to products and services provided by the Companies operating under the FXOpen brand, nor is it to be considered financial advice.
Latest from Trader’s Tools
Latest articles

Bitcoin Price Hits a Month's High, Breaking Key Resistance
Yesterday's release of CPI figures suggests that inflation is slowing down and a rate cut could be on the horizon. This weakened the dollar and boosted the value of assets priced in dollars, including BTC/USD.
As a result, the

The US Dollar Is Weakening Following Inflation Data
Yesterday saw the release of key economic indicators for the US. According to ForexFactory:
→ Core Price Index (CPI) monthly: actual = 0.3%, expected = 0.4%, previous = 0.4%;
→ Core Price Index (CPI) annual: actual = 3.4%, expected = 3.4%, previous

Analytical XRP Price Forecasts: What Are the Expectations for 2024-2030?
As XRP navigates the volatility and uncertainty of digital currencies, its price trajectory remains a subject of keen interest and speculation. This article delves into the historical price movements, current challenges, and future potential of XRP, offering various analytical predictions