


FXOpen

In the world of forex trading, understanding the nuanced tools at your disposal can significantly enhance decision-making processes. One such sophisticated tool is the Anchored Volume-Weighted Average Price (Anchored VWAP), which refines the standard VWAP by allowing traders to set a specific starting point.
This article delves into the functionality of AVWAP, illustrating how it can be strategically used in forex trading to provide a clearer view of market dynamics.
Understanding VWAP
The Volume-Weighted Average Price (VWAP) is an essential indicator in the toolkit of traders and investors, particularly valuable in financial markets like forex. It offers a snapshot of an asset's price, weighted by the volume of assets traded. Unlike simple averages, which only consider closing prices, the VWAP indicator takes into account both price and volume, providing a more comprehensive view of activity throughout the trading day.
Essentially, the VWAP indicator calculates the cumulative average price of the asset, factoring in the volume of transactions at each point. This calculation begins at the opening of the market and continues throughout the trading session. It's typically represented as a single line on trading charts, moving with price changes and adjusted for volume fluctuations, often alongside standard deviation bands based on the VWAP line.
VWAP: Sum of (Typical Price * Volume) / Sum of Volume
- Determine the typical price of the session’s initial candle - (High + Low + Close) / 3.
- Multiply the volume of the first candle by its typical price - (Volume * Typical Price).
- Calculate the cumulative sum of (Volume * Typical Price) from the first candle to the current.
- Calculate the cumulative sum of Volume from the first candle to the current.
- Divide the total of (Volume * Typical Price) by the sum of Volume to generate.
For traders, VWAP serves as a benchmark for measuring the efficiency of trade executions. A trade executed near the VWAP value suggests that a trader has bought or sold at a reasonable value. Moreover, it helps in identifying trends and potential reversals by showing whether current prices are above or below the average, indicating overbought or oversold conditions, respectively.
Want to see how the VWAP works? Head over to FXOpen’s TickTrader platform to explore the VWAP and hundreds of other trading tools.
Introduction to Anchored VWAP
Anchored Volume-Weighted Average Price (AVWAP) evolves from the basic concept of the VWAP by allowing traders to specify a starting point in time, or an "anchor," from which the average is calculated. This adaptation is particularly useful in the forex market, where understanding the impact of specific events or periods on market movements is crucial for strategy development.
The traditional VWAP provides a cumulative average value of an asset throughout a trading day, integrating volume into the pricing to reflect where most trading activity occurs. However, its calculation starts afresh each day, which can sometimes obscure the effects of significant events occurring at specific times.
AVWAP addresses this by letting traders set an anchor point—this could be the time of a major economic announcement, the beginning of a financial quarter, or any other significant event that traders believe will impact currency values.
By anchoring the VWAP to a chosen moment, traders gain the ability to analyse the price movement and trading volume from that point forward, offering a clearer view of how specific events influence market dynamics. This makes AVWAP an invaluable tool for more precise, contextual analysis in forex trading.
Anchored VWAP vs VWAP
In short, while the traditional VWAP resets at the beginning of each trading session and provides a broad, day-long snapshot of price and volume, the Anchored VWAP indicator allows for a focused analysis starting from any selected point in time. This key difference enables traders to isolate and evaluate the effects of specific market events or conditions on market movements.
How to Use the Anchored VWAP
Using the Anchored VWAP in a strategy offers forex traders a refined tool for analysing market behaviour and making informed decisions based on the integration of volume and price over a specific period.
Identifying Market Sentiment
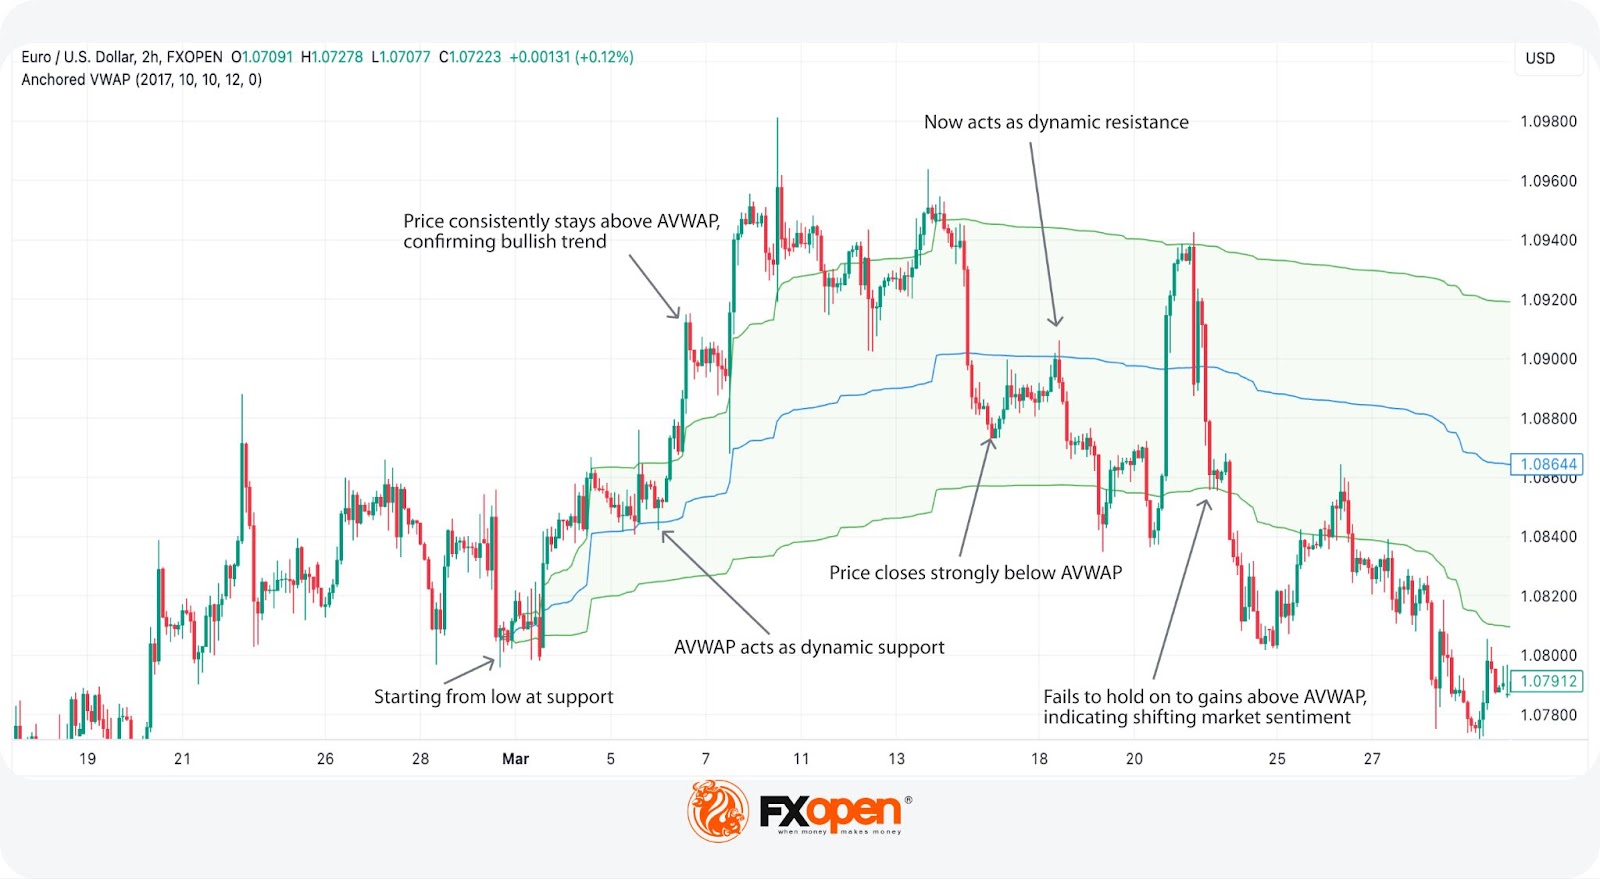
Traders can use AVWAP to assess overall market sentiment following a significant event or as a session progresses. If the price remains above the Anchored VWAP, it generally indicates bullish sentiment, suggesting that buyers are willing to purchase at higher levels.
Conversely, if the price is below the AVWAP line, it can signal bearish sentiment, indicating that sellers are dominating. This positioning provides traders with a clearer understanding of the prevailing mood and can guide trading decisions.
Support and Resistance Levels
Anchored VWAP can act as a dynamic support or resistance level. Traders often watch these levels closely for signs of the market bouncing off (support) or retreating from them (resistance). Breakthroughs of the AVWAP may signal a significant shift in market dynamics, prompting a reevaluation of existing trading positions.
Trend Confirmation
Traders use Anchored VWAP to confirm the strength and validity of a prevailing trend. If prices consistently stay above the AVWAP during an uptrend, it confirms the strength of the bullish trend. Conversely, prices remaining below the AVWAP in a downtrend confirm bearish strength. If the market closes above or below the AVWAP contrary to the current trend, it can signal that the trend may be reversing, at least momentarily.
However, it’s important to note that the Anchored VWAP often forms part of a broader strategy. In isolation, it can produce false signals, especially in choppy markets or if the placement of the AVWAP is incorrect.
Where to Anchor VWAP in Forex Trading
Anchored VWAP is a versatile tool in forex trading, providing traders the flexibility to select an anchor point that best suits their strategy and analysis needs. Choosing an appropriate anchor point is crucial as it sets the baseline from which the VWAP begins its calculations, thus influencing its interpretation.
Major Economic Announcements
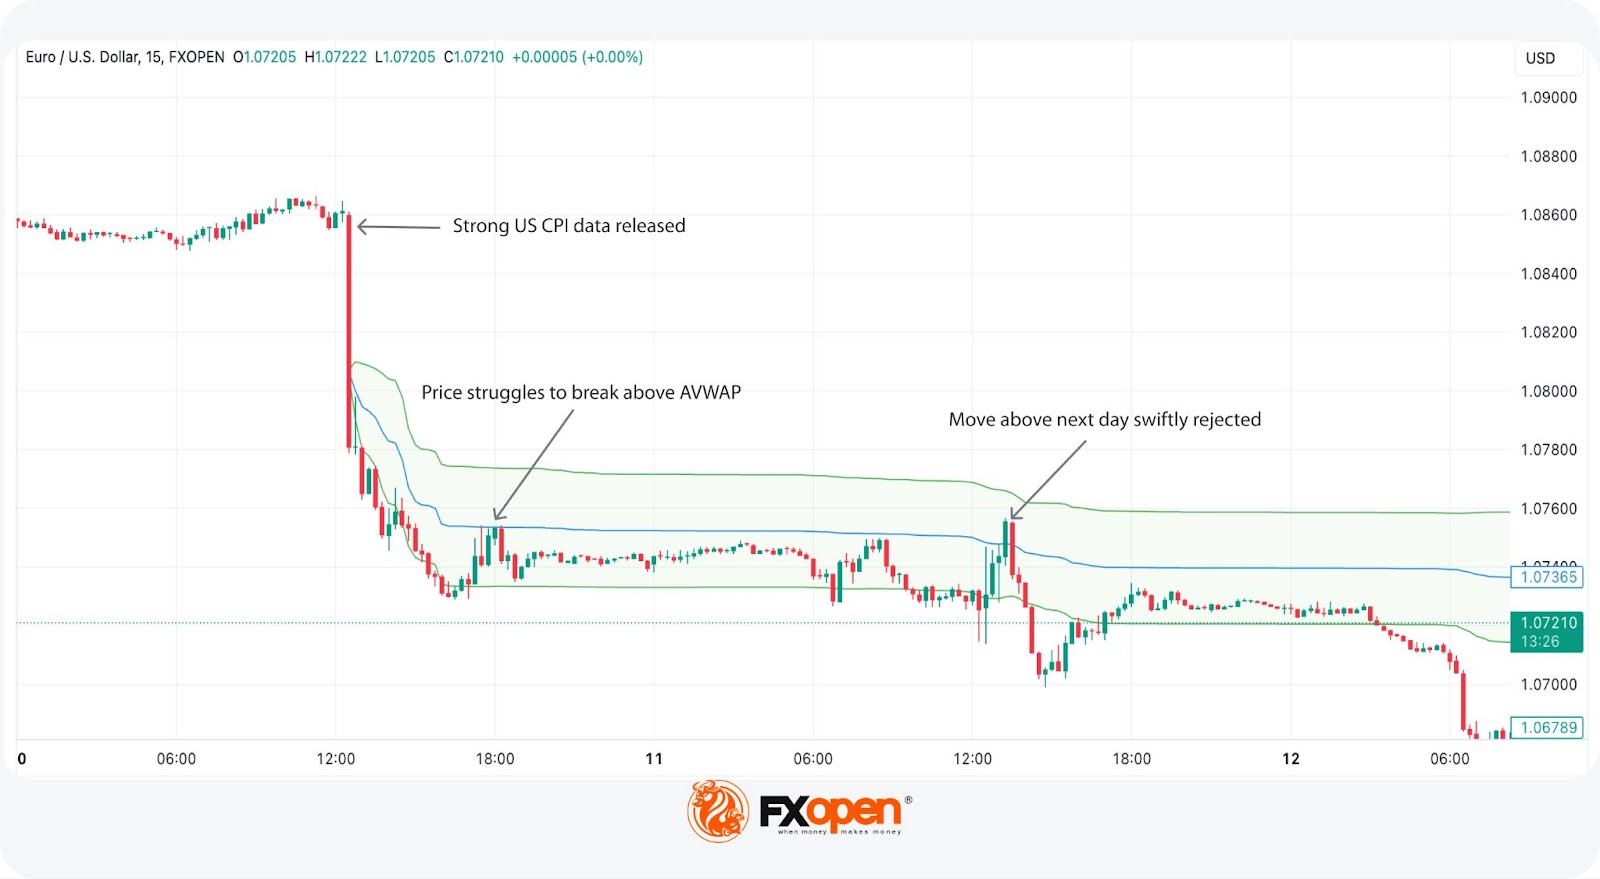
Anchoring VWAP at the time of significant economic reports (like GDP releases, central bank decisions, or employment data) allows traders to gauge the market's reaction to these events. This can provide insights into whether the initial reactions hold steady or reverse as more traders digest the news.
Session Open/Close
The opening or closing of a major session, such as London or New York, often brings heightened volatility and trading volume. Starting the VWAP calculation from these points can help traders understand how prices are behaving under the influence of these shifts in market activity.
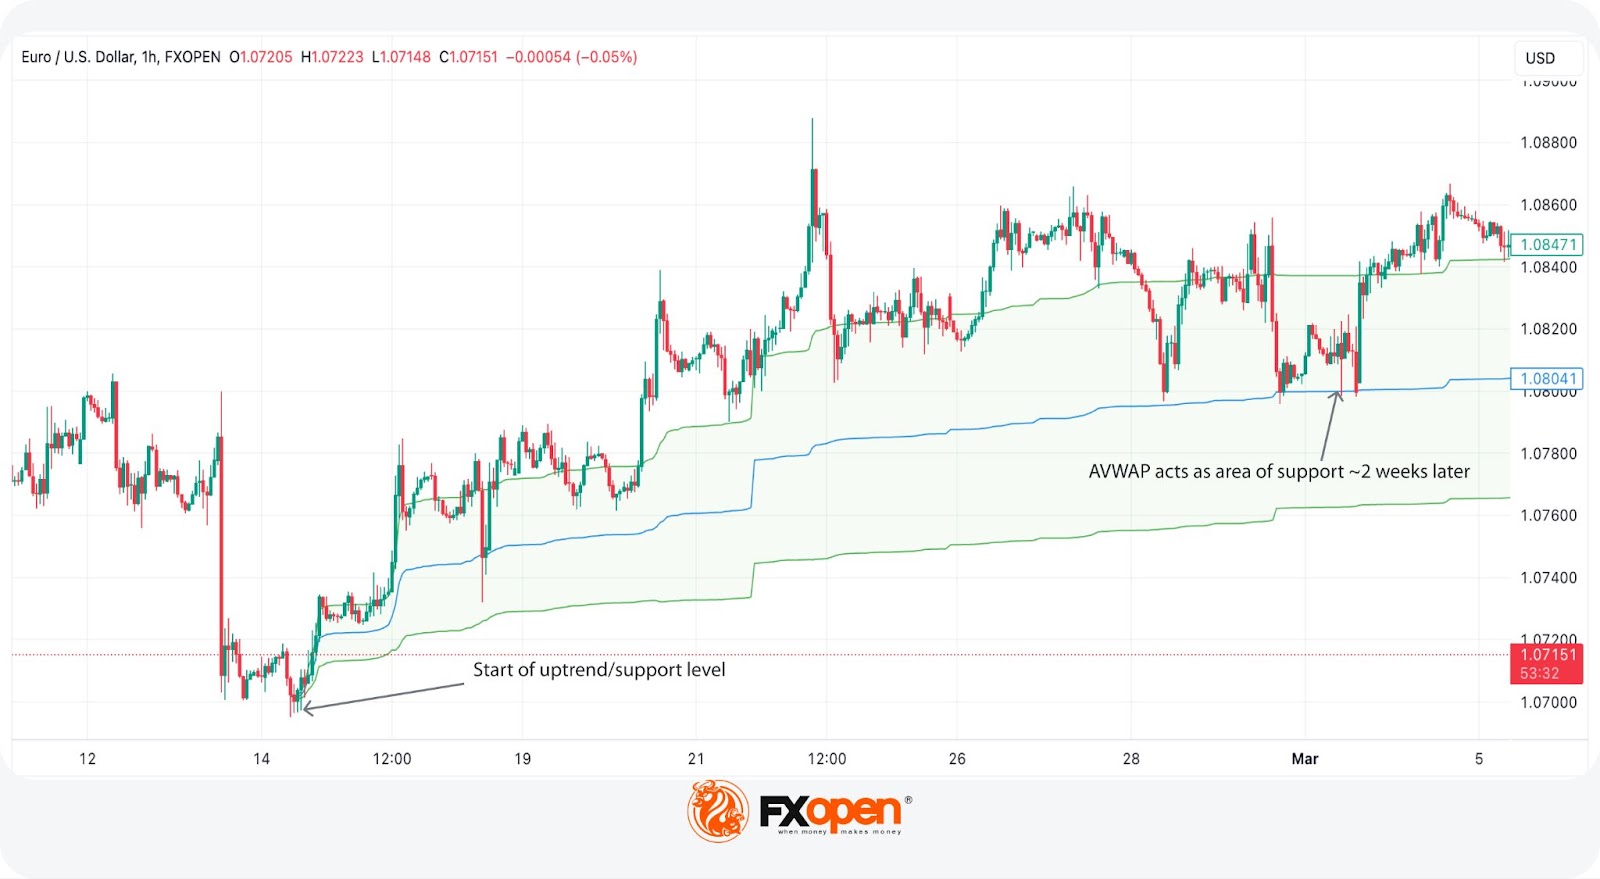
Start of a Trend
Anchoring VWAP at the onset of a new trend provides a reference point against which the strength and sustainability of the trend can be measured. This is particularly useful for distinguishing genuine trends from short-term fluctuations.
Specific Technical Levels
Anchoring VWAP at important technical levels, such as established support or resistance zones, allows traders to monitor price interactions around these critical points, providing insights into potential breakout or rebound scenarios.
The Bottom Line
The Anchored VWAP can be an invaluable tool for forex traders looking to deepen their analysis and refine their trading strategies. By providing insights into price movements from a chosen anchor point, it empowers traders with the ability to make more informed decisions. For those ready to apply these techniques in real-world trading, opening an FXOpen account could be the next step to leveraging these insights effectively in the forex markets.
FAQs
What Is Anchored VWAP?
Anchored VWAP (Volume-Weighted Average Price) is a trading tool that modifies the standard VWAP by allowing traders to set a specific starting point or anchor. This point could be the time of a significant event, market opening, or any other moment significant to the trader’s strategy. It provides a customised view of price and volume data from that point forward, offering insights into how events impact market dynamics.
How Is VWAP Calculated?
VWAP is calculated by taking the cumulative value of all trading transactions (price multiplied by the number of units, like contracts or shares, traded) and dividing it by the total units traded during the period being analysed. This gives a volume-weighted average price of the asset throughout the day.
How to Use Anchored VWAP?
Anchored VWAP is used by traders to gauge sentiment, identify support and resistance levels, and confirm trend directions. By setting an anchor point, traders can observe how prices interact with the VWAP from a specific event or time. This helps them understand the strength of the market movements and volume significance since that anchor facilitates more informed and strategic trading decisions.
This article represents the opinion of the Companies operating under the FXOpen brand only. It is not to be construed as an offer, solicitation, or recommendation with respect to products and services provided by the Companies operating under the FXOpen brand, nor is it to be considered financial advice.
Latest articles

Weekly Market Wrap With Gary Thomson: FTSE100, US Dollar, USD/JPY, BTC/USD
Get the latest scoop on the week's hottest headlines, all in one convenient video. Join Gary Thomson, the COO of FXOpen UK, as he breaks down the most significant news reports and shares his expert insights.
- London Calling! FTSE 100

The Price of Silver (XAG/USD) is Falling for the Second Consecutive Week
Following a surge in the price of silver close to the important psychological level of $30 per ounce on April 12, bearish momentum is now evident - concluding the week may mark the second consecutive week of decline for XAG/

AAPL Share Price Soars after Record Buyback Announced
Yesterday, after the end of the main trading session, Apple published its report on its activities for the 1st quarter:
→ Earnings per share: actual = $1.53; expected = $1.505;
→ Gross income: actual = $90.75; expected = $90.36.
The better-than-expected report