


FXOpen

Understanding the nuances of supply and demand is essential for traders to discern potential market reversals, identify trend continuations, and execute well-informed trading strategies. This article delves into the core patterns and strategies of trading based on these zones, providing a structured approach to identifying potential trading opportunities.
What Are Supply and Demand Zones?
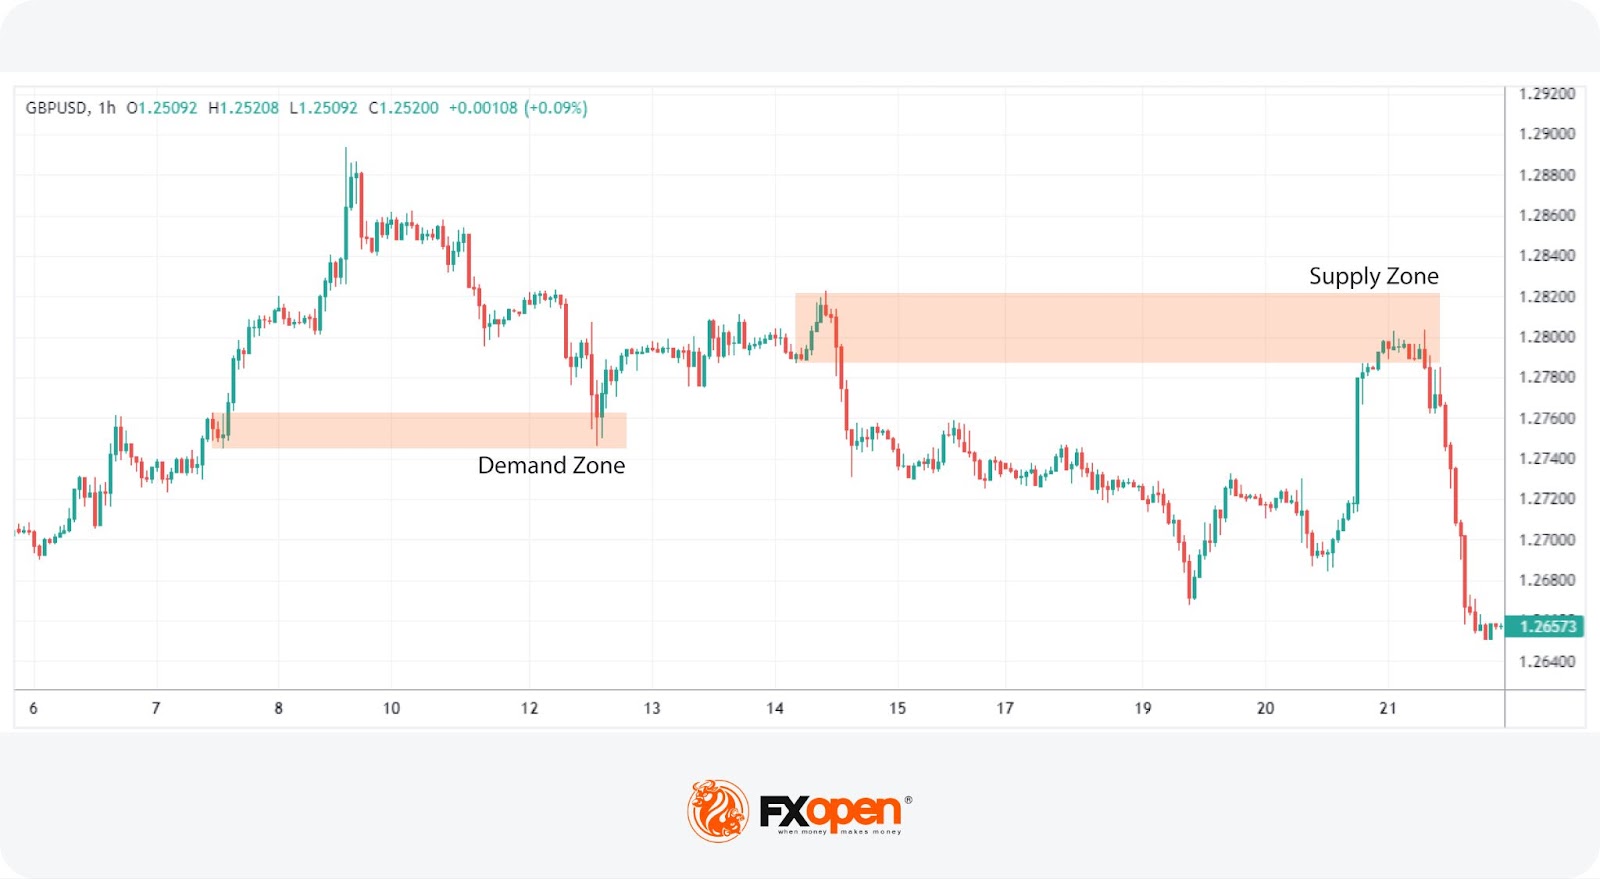
Supply and demand zones are specific areas on a chart that indicate where the price of an asset has historically made significant moves, either upwards or downwards. These zones are identified by observing patterns where price action has shown a strong reaction—either a sharp increase (demand zone) or a sharp decrease (supply zone).
A demand zone is typically found where the market has stopped falling and then shot upwards. This area represents a level where buyers found the price attractive enough to enter the market in large numbers, driving it up. Conversely, a supply zone represents a level at which selling interest overcomes buying pressure, causing the price to fall sharply. This is typically where sellers find the asset overvalued and decide to exit their positions or open new positions to sell.
These zones are typically drawn at the ‘bases’ found in the patterns described below, from the consolidation’s low to high. Identifying these zones can provide traders with insights into potential future movements, as prices often retest these levels. When the price returns to a supply or demand zone, it can indicate an opportunity for traders to open new positions in anticipation of a repeat of past market behaviour.
The Role of Accumulations and Distributions
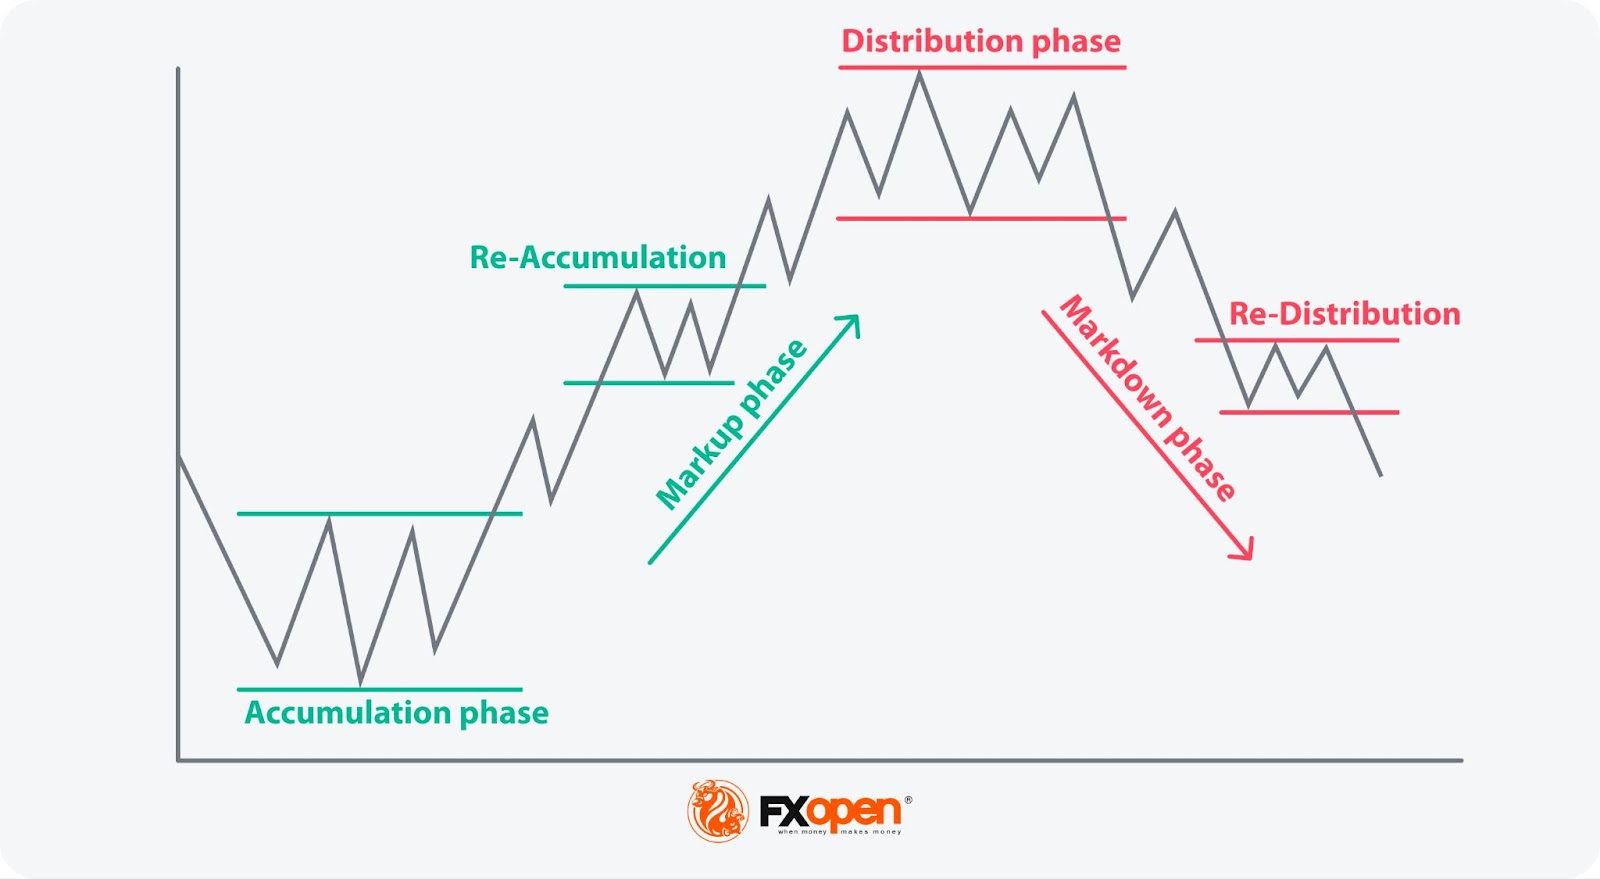
Accumulation and distribution are critical in understanding how supply and demand zones form and behave in financial markets. These terms describe the actions taken by influential market players—often large institutional investors or "smart money"—as they prepare for a potential price movement. They form a key component of Wyckoff trading.
Accumulation occurs when these entities begin to buy or "accumulate" a long position over a period, typically at lower levels. This phase is generally not accompanied by a notable price increase, as the buying is done gradually to avoid significant movements that could attract attention. The end of an accumulation phase is often marked by a reaccumulation, where buying resumes after a brief rally and pullback/consolidation, further establishing a demand zone.
Distribution reflects the opposite scenario, where large holders begin to sell their holdings, usually after a rise. This selling does not immediately lead to a drop; it happens subtly to prevent a drastic decrease in price. Following a distribution phase, a redistribution might occur where selling continues after a minor rally or consolidation—this process helps solidify a supply zone.
The Four Key Patterns in Supply and Demand Trading
Recognising specific patterns in supply and demand zones can significantly assist traders in determining potential market movements. These patterns, derived from price action and the behaviour of market participants, provide visual cues on charts that suggest future trajectories. Here are four key patterns:
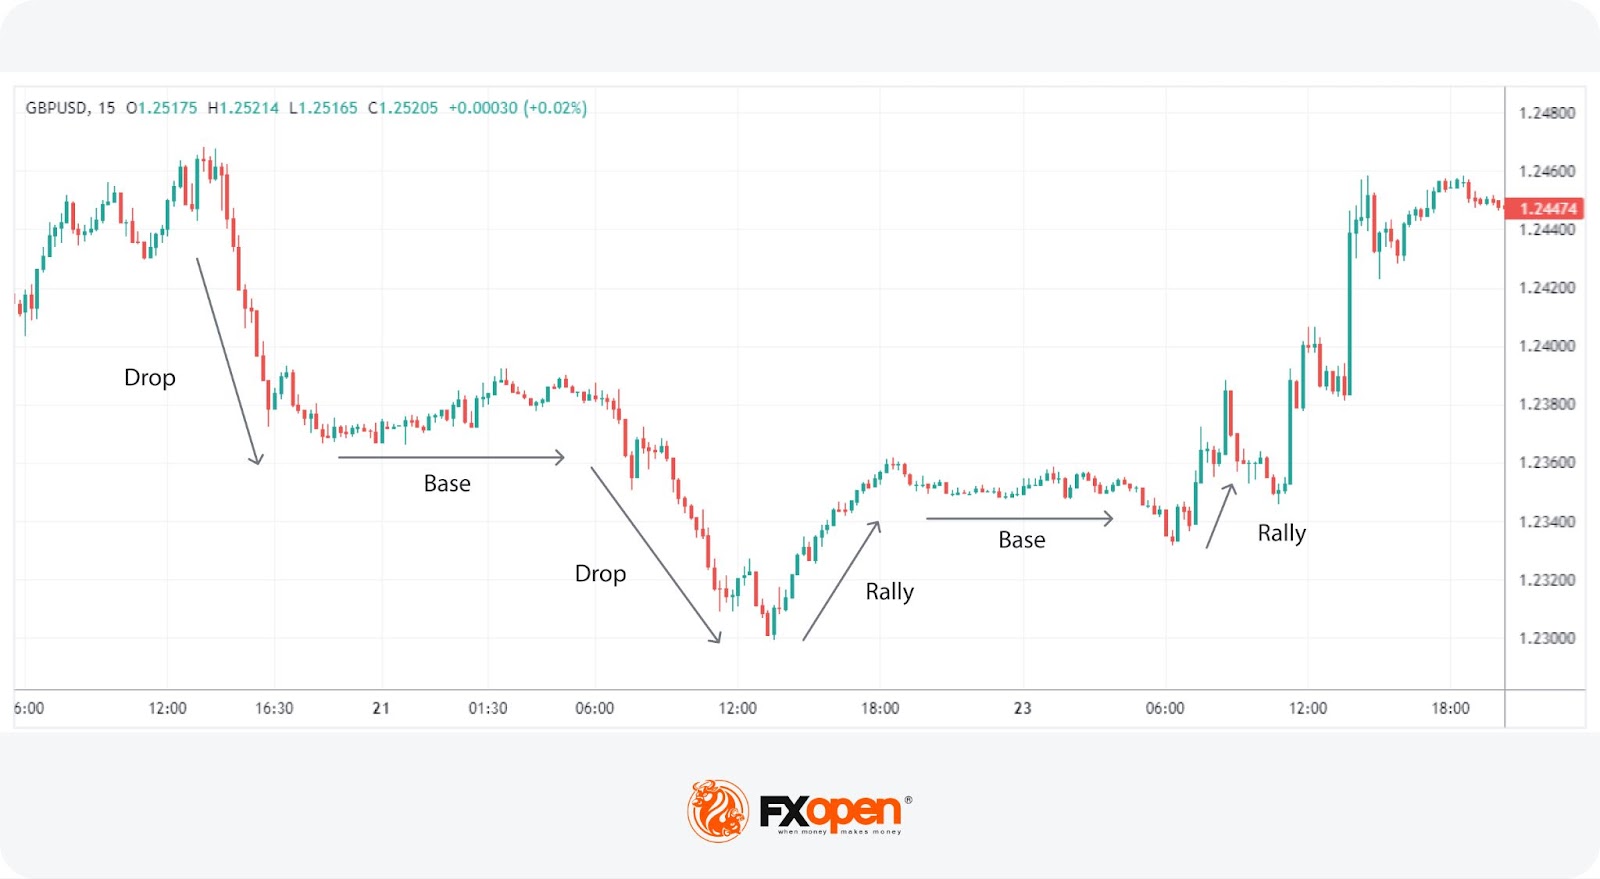
1. Rally-Base-Rally (RBR)
This pattern is a bullish indicator and occurs as the price leaves an accumulation/demand zone. The sequence starts with a rally, where there is a noticeable upward movement. This is followed by a base, a period where prices consolidate within a relatively narrow range, indicating a balance between buyers and sellers. The pattern completes with another rally, suggesting that demand has overwhelmed supply, pushing prices higher.
Recognising the Rally-Base-Rally pattern can signal traders to consider a long position as the market sentiment will likely continue upward.
2. Drop-Base-Drop (DBD)
Mirroring the RBR, the Drop-Base-Drop pattern is a bearish formation found after a successful distribution from a supply zone. It begins with a drop, indicating strong selling pressure. The base phase occurs next, where the price moves sideways briefly, showing uncertainty or equal force from buyers and sellers. A subsequent drop follows, demonstrating renewed selling pressure and an overpowering supply.
As the price leaves the base, there’s a potential selling opportunity for traders expecting further declines.
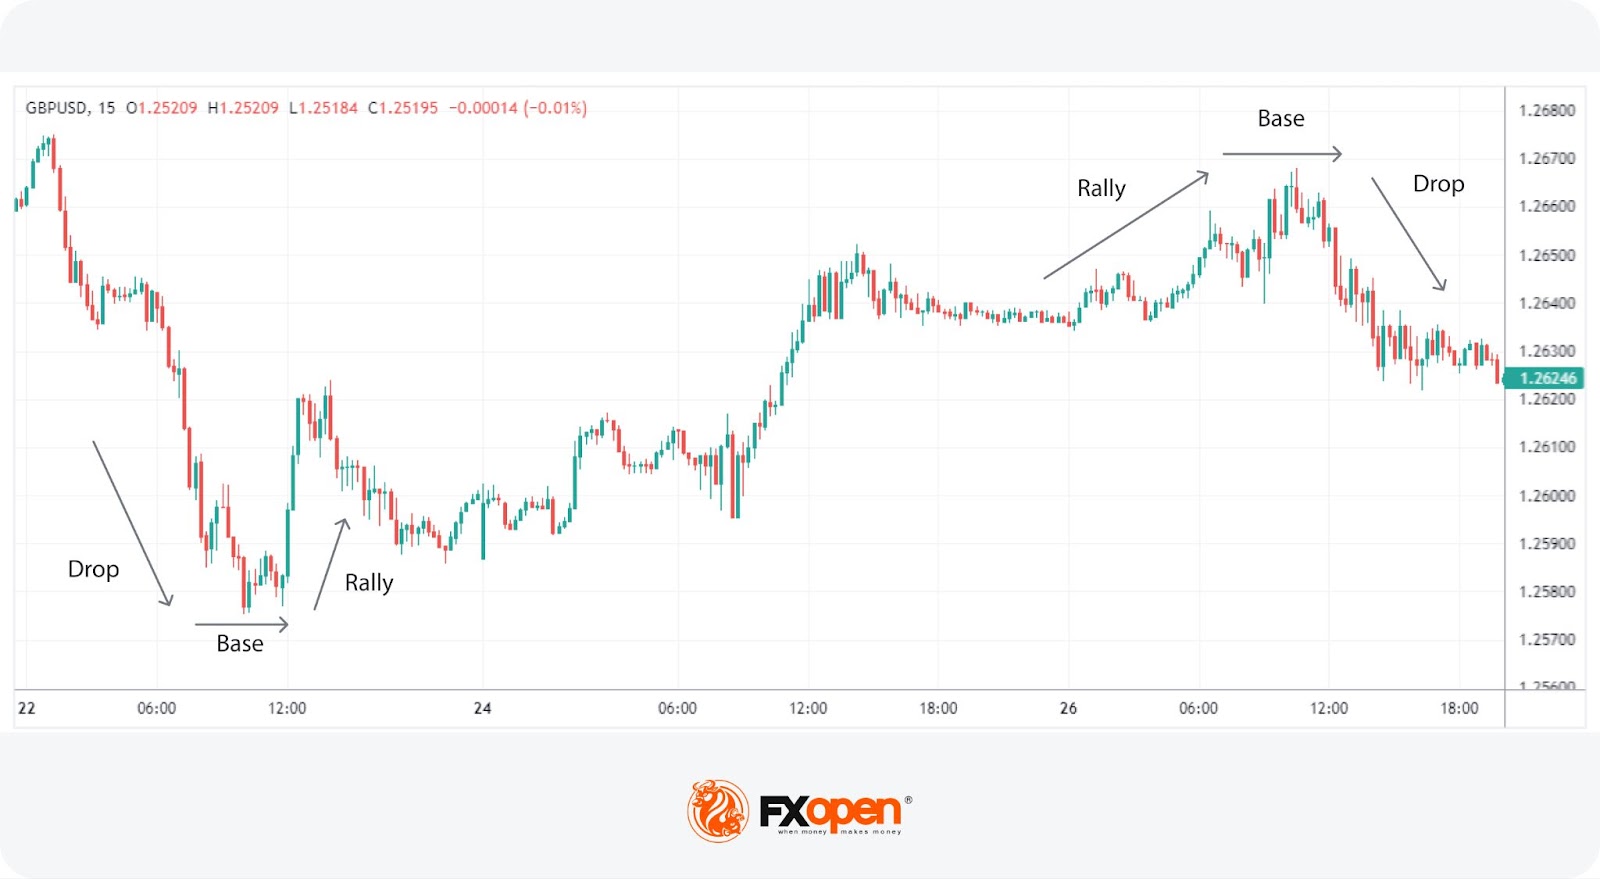
3. Rally-Base-Drop (RBD)
The Rally-Base-Drop pattern typically signals the formation of a supply zone and is indicative of a bearish reversal. It starts with a rally, where buyers temporarily gain control. However, this rally is short-lived and leads into a base phase—a period of consolidation. The critical phase is the subsequent drop, where sellers dominate, reversing the initial upward trend.
This pattern is particularly valuable for traders looking to capture the shift from a bullish to a bearish market.
4. Drop-Base-Rally (DBR)
Contrary to RBD, the Drop-Base-Rally pattern indicates a bullish reversal and creates a demand zone. It starts with an initial drop, reflecting strong selling. This phase is followed by a base, where the market finds equilibrium and the selling pressure begins to wane. The final phase is a rally, suggesting that buyers have regained control and are likely to push prices higher.
This pattern aids traders in spotting potential entry points for long positions as the market sentiment shifts from bearish to bullish.
To try spotting these patterns for yourself, head over to FXOpen’s free TickTrader platform to access real-time charts.
How to Trade Supply and Demand Zones
Trading supply and demand zones effectively involves understanding their potential role as areas of support (demand) or resistance (supply). In an established trend, these zones are formed from bases—periods of consolidation—that, once the price breaks out and moves in a consistent direction, are likely to act as areas of support or resistance on return.
For instance, in a Rally-Base-Rally (RBR) pattern, the base, after the initial rally, is likely to act as a demand zone. If prices revisit this base, it typically serves as a support level, where the price is expected to stop falling and start rising again. Conversely, in patterns like Drop-Base-Rally (DBD), the base also functions as a demand zone. Here, if the price falls back to this zone, it is anticipated to encounter support, leading to a potential bullish move away.
Supply and Demand Zones: Trading Strategies
Trading strategies based on supply and demand zones are centred around the identification and reaction to key levels that indicate underlying shifts in market sentiment. Traders often focus on how price exits these zones to gauge potential continuation or reversal of trends.
Strategy for Rally-Base-Rally (RBR) and Drop-Base-Drop (DBD)
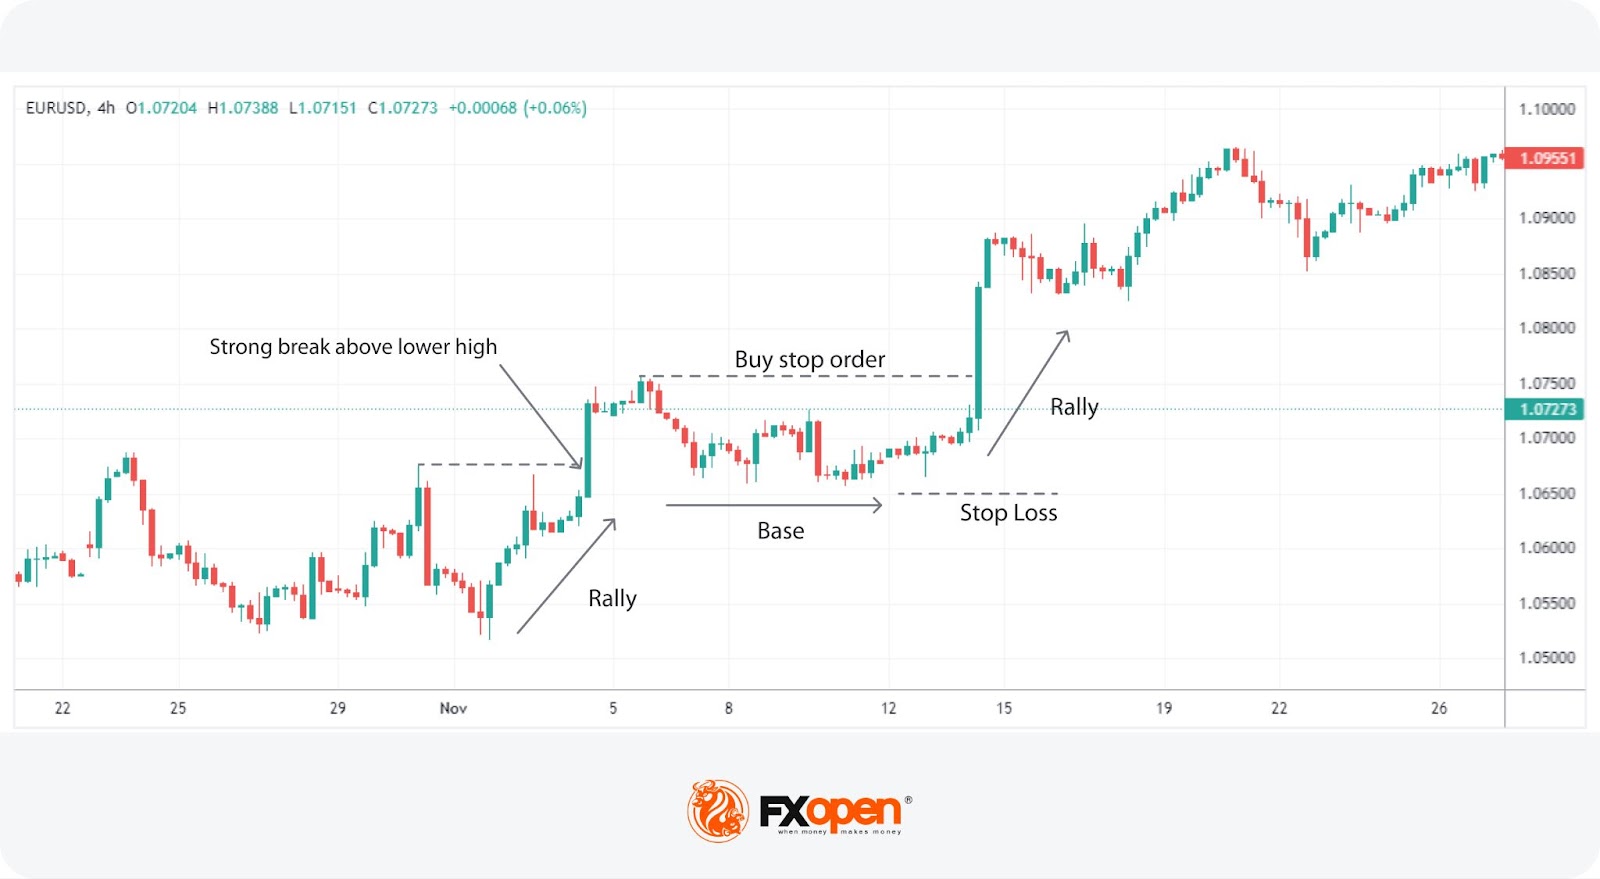
This Drop-Base-Drop/Rally-Base-Rally strategy capitalises on the formation of a base after a distinct move that often breaks an established trend, i.e. moving sharply above a lower high in a downtrend or higher low in an uptrend.
Traders look to this pattern as it leverages the momentum generated from a strong initial move (rally or drop) followed by a stabilisation period (base) that offers a clear breakout point, indicating a potential trend continuation.
Entry
- Traders typically monitor the price as it rallies or drops, forming a base.
- A breakout from the consolidation zone is awaited, where the price moves above the high in RBR or below the low in DBD.
- Entry may be made via a stop order at the breakout point to capture the movement as it happens.
Stop Loss
- It may be placed just outside the opposite side of the base range to protect against false breakouts.
Take Profit
- It may be set at previously identified supply or demand zones where price may potentially react and reverse.
Strategy for Rally-Base-Drop (RBD) and Drop-Base-Rally (DBR)
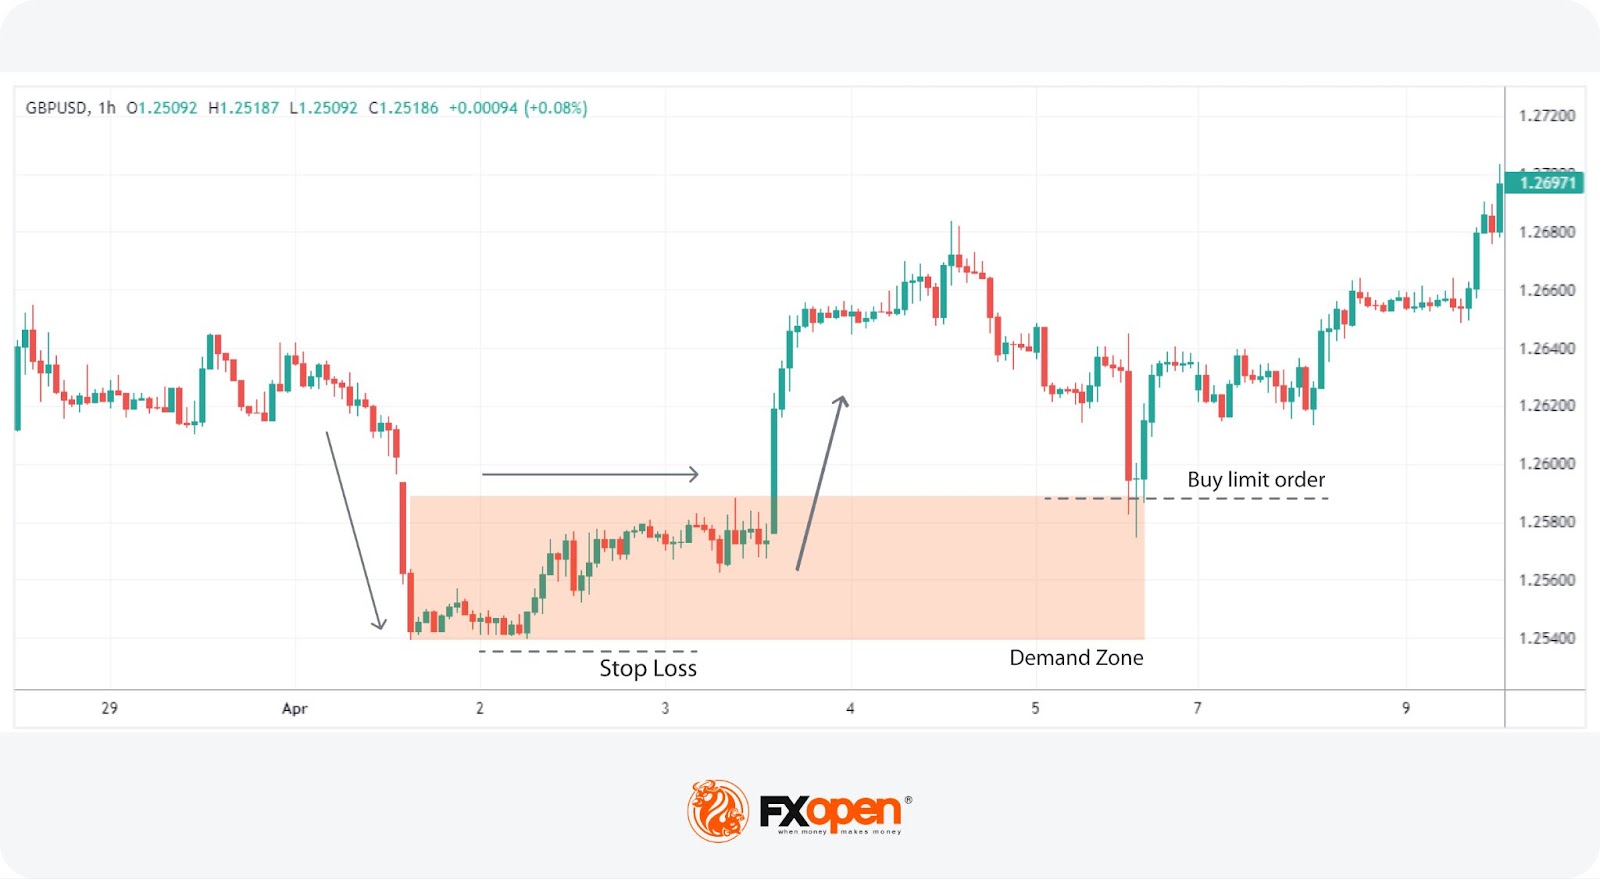
This approach focuses on reversal patterns forming in established supply or demand zones, offering insights into potential trend shifts. It utilises the inherent strength of existing supply or demand zones, coupled with a clear reversal pattern, to identify high-probability trades in line with the trend's direction.
Entry
- Traders observe an established supply or demand zone and look inside it for an RBD or DBR pattern formation, respectively.
- A break of a significant high (in downtrends) or low (in uptrends) within these zones signals the strength of the pattern.
- Following the break, traders wait for a retracement back to the zone, placing a limit order at the edge of the zone.
Stop Loss
- It may be positioned just beyond the opposite side of the zone to safeguard against the price moving beyond the established boundary of the zone.
Take Profit
- It may be targeted at the next significant supply or demand zone that could oppose the current movement.
The Bottom Line
Supply and demand zones and their related patterns can offer traders a potential edge across various asset types, including forex, stocks, commodities, and cryptocurrencies*. The strategies described can be a great starting place for anyone looking to explore this trading style. If you’d like to put this theory into practice, consider opening an FXOpen account to access a wide range of assets and our advanced TickTrader platform.
FAQs
What Is a Supply and Demand Zone in Trading?
Supply and demand zones are specific areas on a trading chart where significant buying (demand zones) or selling (supply zones) activity has occurred, causing the price to move dramatically. These zones are used to identify potential areas where the price might either stall or reverse based on past trading activity.
What Is the Difference Between Supply & Demand Zones and Support & Resistance Zones?
While both supply and demand zones and support and resistance zones identify key levels, supply and demand zones are identified by areas that cause substantial price movements, whereas support and resistance are defined by frequent price reversals at certain price levels.
What Are the 4 Stages of the Market Cycle?
The four stages of the market cycle include Accumulation, Markup, Distribution, and Markdown. These stages describe the systematic process of price movement in markets, from periods where smart money accumulates positions to phases where these positions are distributed, leading to price declines.
*At FXOpen UK and FXOpen AU, Cryptocurrency CFDs are only available for trading by those clients categorised as Professional clients under FCA Rules and Professional clients under ASIC Rules, respectively. They are not available for trading by Retail clients.
This article represents the opinion of the Companies operating under the FXOpen brand only. It is not to be construed as an offer, solicitation, or recommendation with respect to products and services provided by the Companies operating under the FXOpen brand, nor is it to be considered financial advice.
Latest from Trader’s Tools
Latest articles

Bitcoin Price Hits a Month's High, Breaking Key Resistance
Yesterday's release of CPI figures suggests that inflation is slowing down and a rate cut could be on the horizon. This weakened the dollar and boosted the value of assets priced in dollars, including BTC/USD.
As a result, the

The US Dollar Is Weakening Following Inflation Data
Yesterday saw the release of key economic indicators for the US. According to ForexFactory:
→ Core Price Index (CPI) monthly: actual = 0.3%, expected = 0.4%, previous = 0.4%;
→ Core Price Index (CPI) annual: actual = 3.4%, expected = 3.4%, previous

Analytical XRP Price Forecasts: What Are the Expectations for 2024-2030?
As XRP navigates the volatility and uncertainty of digital currencies, its price trajectory remains a subject of keen interest and speculation. This article delves into the historical price movements, current challenges, and future potential of XRP, offering various analytical predictions