


FXOpen

Kill Zones represent key periods when market volatility and trading volume surge. This article delves into the concept of Kill Zones, their strategic importance, and practical insights on how traders can leverage these windows for effective trading.
Understanding Kill Zones
Why do ICT Kill Zones matter? A Kill Zone in forex trading refers to a specific time period during which currency pairs experience increased volatility and volume. These periods are crucial for traders who aim to capitalise on significant price movements. The concept, popularised by Michael Huddleston, also known as the Inner Circle Trader, highlights the importance of timing in trading strategies.
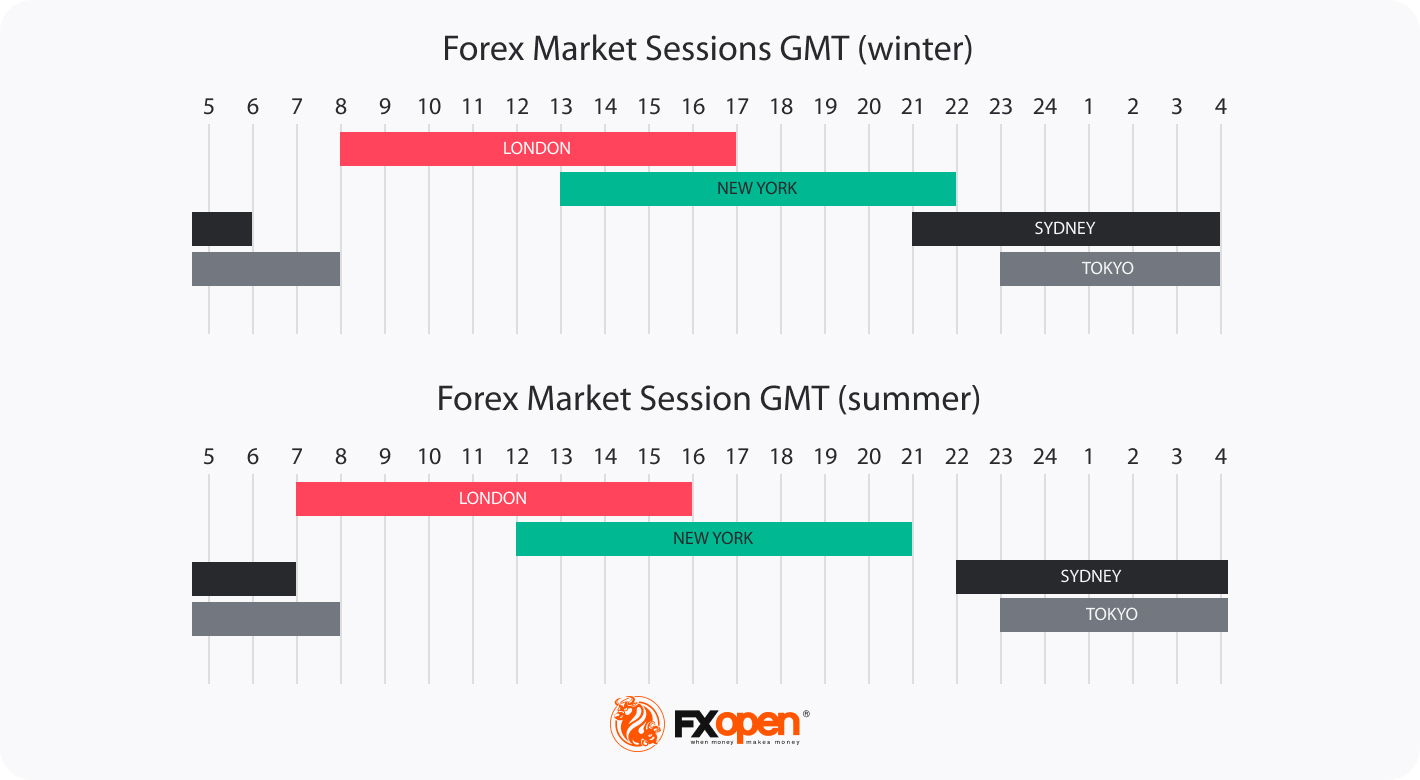
The strategies are based on global forex hours. The forex market operates 24 hours a working day across four major sessions: Sydney, Tokyo, London, and New York. The interaction between these sessions, particularly at their opening and closing times, creates unique opportunities for traders. The heightened activity during these periods can lead to greater liquidity and faster price movements.
The Four Primary Kill Zones
The four primary Kill Zones represent strategic windows where trading volume and volatility peak due to the interplay of global market sessions. Each period corresponds to key transitions in major forex markets worldwide.
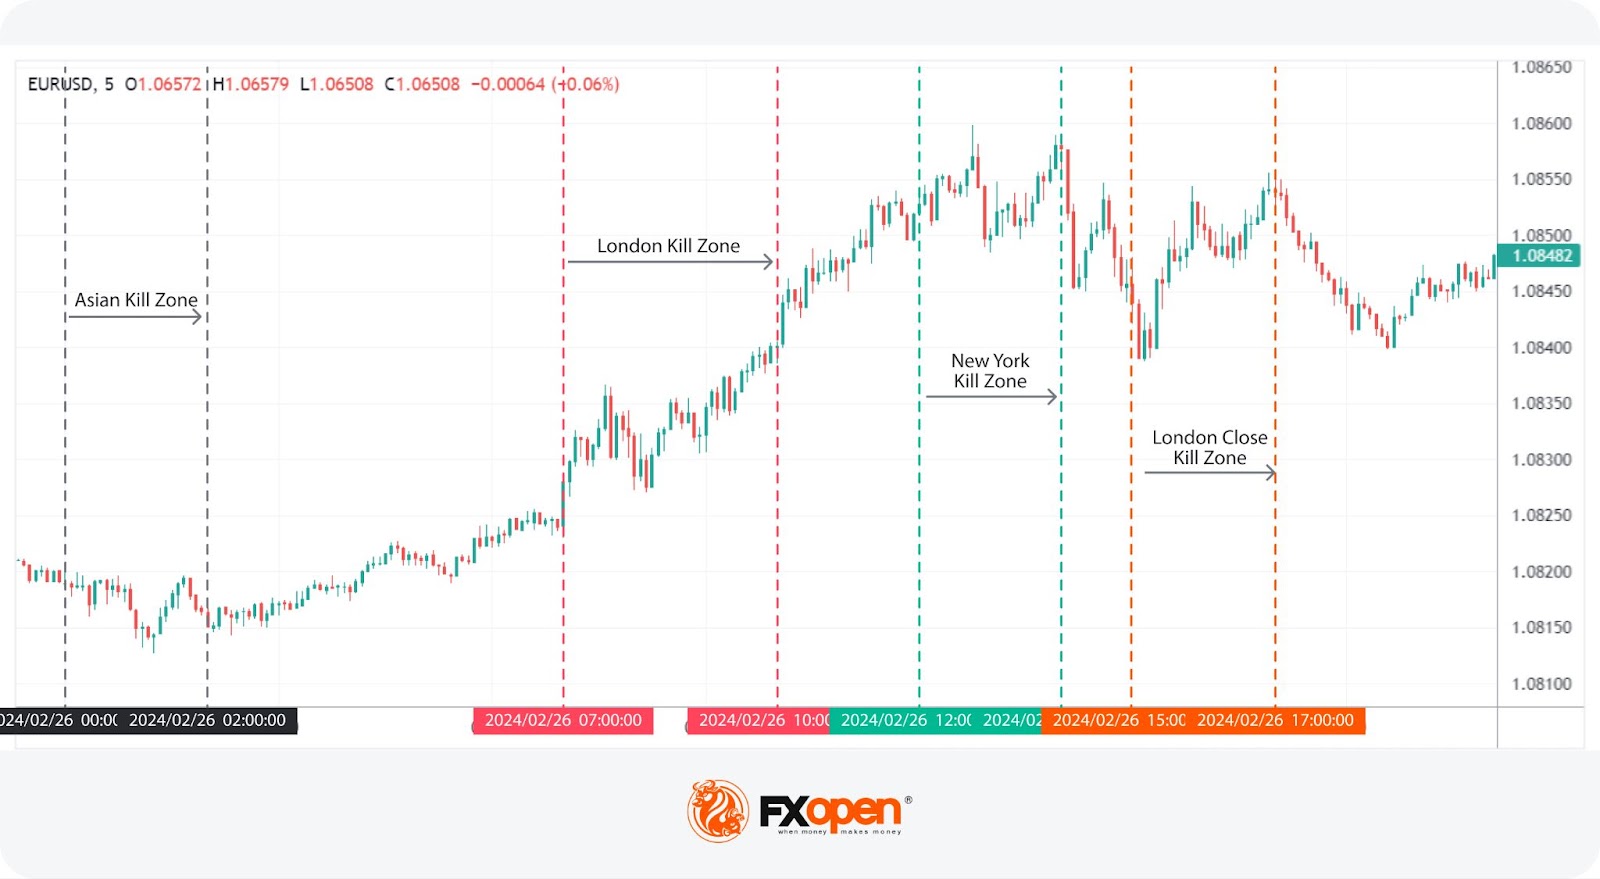
Below, we’ve described each along with the key ICT Kill Zone times. You can see how currency pairs react during these times in FXOpen’s free TickTrader platform.
1. Asian Kill Zone
Asian Kill Zone Time Period: 23:00 GMT to 02:00 GMT in winter and in summer
This window coincides with the opening of Asian markets, primarily Tokyo. This period sees increased activity in currency pairs with AUD, NZD, and JPY.
The US dollar typically shows consolidation, providing an environment ripe for scalping strategies. Traders often monitor for optimal trade entry (OTE) patterns, another ICT concept, during this time, capitalising on the day’s initial movements and setting the stage for the European session.
2. London Kill Zone
London Kill Zone Time Period: 08:00 GMT to 11:00 GMT in winter (07:00 GMT to 10:00 GMT in summer)
This window is known for its volatility and significant trading volume, particularly involving EUR and GBP. As the London session opens, it often establishes the daily highs (in bullish markets) or lows (in bearish markets), reacting to developments from the Asian session.
Traders analyse market movements to prepare for potential breakouts or reversals. This window can be crucial when setting up trades, especially for currency pairs that show little activity overnight but become volatile with the London opening.
3. New York Kill Zone
New York Kill Zone Time Period: 13:00 GMT to 16:00 GMT in winter (12:00 GMT to 15:00 GMT in summer)
This window marks the overlap of the London and New York sessions, creating a critical period for USD-paired currencies. The dynamics of this period are influenced by the activity of traders from both continents being concurrently active. Traders seek continuation or reversal of the trends established over the London session, employing strategies that capitalise on the volatility to maximise returns.
4. London Close Kill Zone
London Close Kill Zone Time Period: 15:00 GMT to 17:00 GMT in winter (14:00 GMT to 16:00 GMT in summer)
As the London session concludes, this window typically exhibits less volatility but still offers opportunities for strategic trades. Traders might observe retracements or continuations of earlier trends. During this period, strategies often revolve around identifying trend exhaustion and preparing for potential reversals as European traders close their positions, influencing pair directions before the close of the American session.
Practical Considerations for Trading Kill Zones
When engaging with Kill Zones in forex, practical considerations are key to leveraging these periods effectively. Keep in mind these things:
Navigating Time Zone Shifts
Traders must account for time zone shifts such as British Summer Time (BST) and Eastern Daylight Time (EDT) when planning their trading schedules. These shifts can impact the real-time operation of forex markets by altering the relative timing of session openings and peak activity periods.
BST is GMT+1, moving the London window to an hour earlier for those trading on GMT. During BST, which typically runs from late March to late October, the London Kill Zone shifts from 07:00 to 10:00 GMT. Conversely, EDT, which is GMT-4, affects those in the US by advancing the New York window to start and end an hour earlier. This period typically extends from the second Sunday in March to the first Sunday in November.
Risk Management
Trading during these windows involves navigating periods of high volatility, where price movements are rapid and unpredictable.
- Volatility-Based Position Sizing: Adjusting position sizes based on volatility may be useful. In more volatile periods like the London or New York openings, reducing position size may help manage potential losses.
- Time-Specific Stop-Loss Orders: Implementing stop-loss orders that reflect the heightened activity levels can help mitigate potential risks. For example, wider stop-loss margins might be necessary across the New York window due to the significant price shifts that can occur when both American and European markets are active.
- Real-Time Monitoring: Active monitoring during these volatile times is vital. Rapid response to price changes can potentially help mitigate losses. Setting alerts at particular levels and indicators may aid in a proactive approach.
The Bottom Line
Understanding and utilising Kill Zones may enhance a trader's ability to strategically enter and exit the market during periods of high volatility and volume. They offer pivotal opportunities for discerning traders to capitalise on significant price movements. For those looking to further explore or leverage these opportunities, opening an FXOpen account could be a valuable step towards engaging with currency pairs during these critical windows.
FAQs
What Is a Kill Zone in Trading?
A Kill Zone in trading refers to specific times in the forex market when price volume and volatility are significantly higher than usual, offering key opportunities for currency trades.
How Do You Use a Kill Zone?
Traders often analyse market conditions and use historical data to identify high-probability opportunities during these volatile windows.
How to Trade Effectively During ICT Kill Zones?
Trading effectively involves understanding each Kill Zone's characteristics and using effective risk management tools to capitalise on increased volatility and liquidity.
What Is the ICT Kill Zone Indicator for TradingView?
The ICT Kill Zone indicator, developed by LuxAlgo, highlights these critical periods directly on TradingView charts, aiding traders in visualising potential trading windows.
This article represents the opinion of the Companies operating under the FXOpen brand only. It is not to be construed as an offer, solicitation, or recommendation with respect to products and services provided by the Companies operating under the FXOpen brand, nor is it to be considered financial advice.
Latest from Trader’s Tools
Latest articles

Bitcoin Price Hits a Month's High, Breaking Key Resistance
Yesterday's release of CPI figures suggests that inflation is slowing down and a rate cut could be on the horizon. This weakened the dollar and boosted the value of assets priced in dollars, including BTC/USD.
As a result, the

The US Dollar Is Weakening Following Inflation Data
Yesterday saw the release of key economic indicators for the US. According to ForexFactory:
→ Core Price Index (CPI) monthly: actual = 0.3%, expected = 0.4%, previous = 0.4%;
→ Core Price Index (CPI) annual: actual = 3.4%, expected = 3.4%, previous

Analytical XRP Price Forecasts: What Are the Expectations for 2024-2030?
As XRP navigates the volatility and uncertainty of digital currencies, its price trajectory remains a subject of keen interest and speculation. This article delves into the historical price movements, current challenges, and future potential of XRP, offering various analytical predictions