


FXOpen

In the ever-evolving world of Smart Money Concept (SMC) trading, a nuanced understanding of market dynamics is indispensable. This article explores the concept of Break of Structure (BOS), how to identify it, and its implications for trading strategies, setting traders on a path to more informed decision-making and strategic market navigation.
Strong and Weak Swing Points
In Smart Money Concept trading, understanding the basics of market structure is crucial, particularly when discerning between strong and weak swing points. These points are pivotal in analysing the current trend and play a significant role in identifying potential breaks in structure.
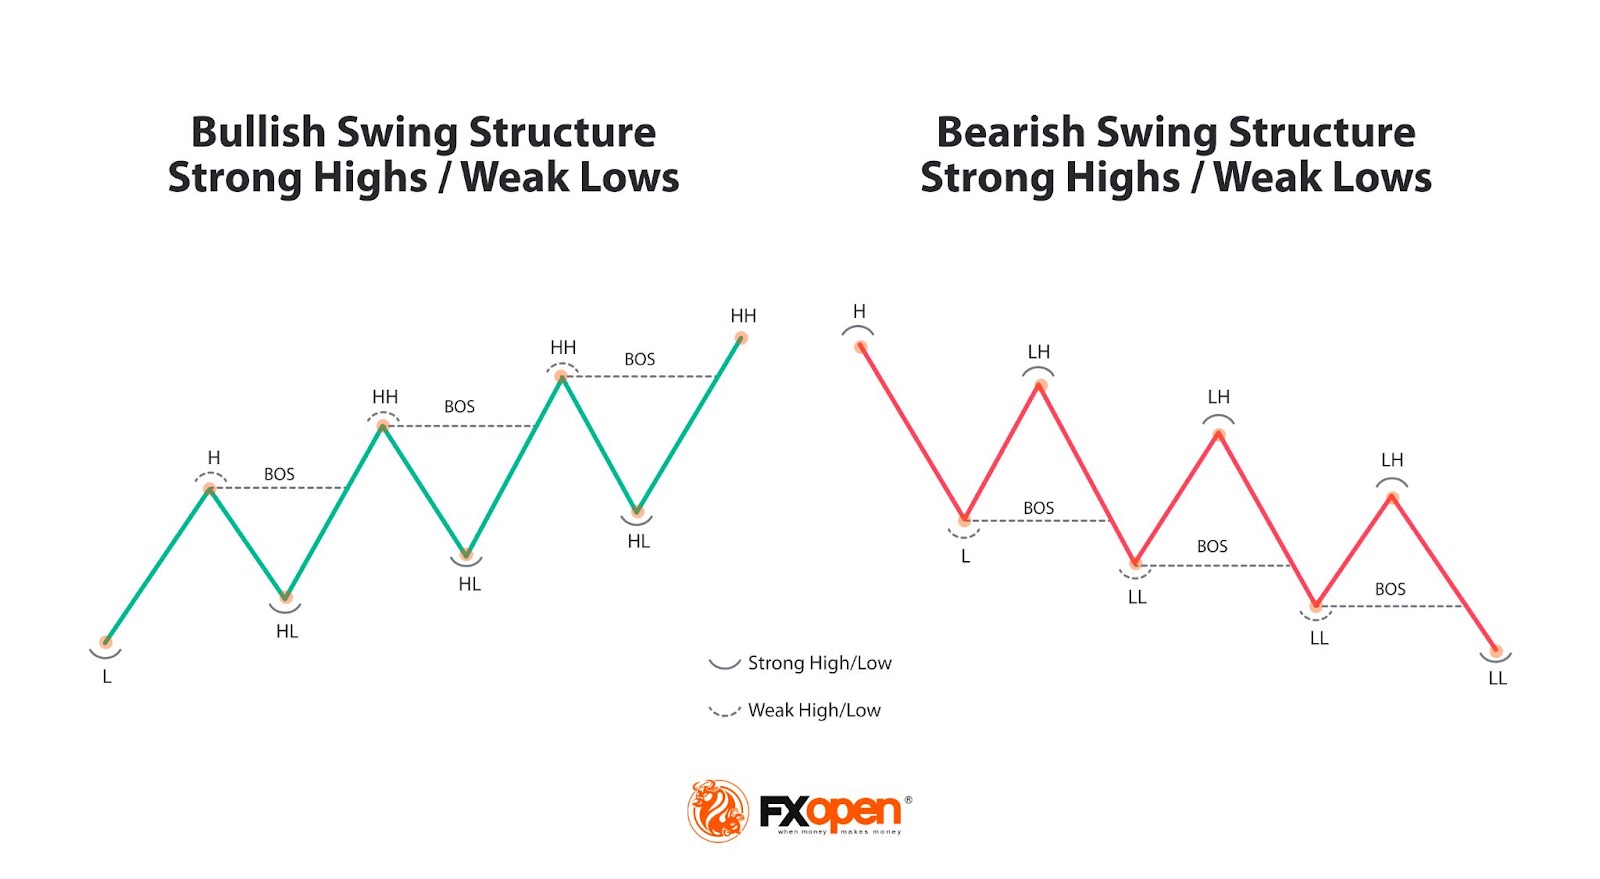
A strong swing point, whether it be a high in a downtrend or a low in an uptrend, is considered to be likely to hold if the price revisits the area. A bullish trend, for example, is denoted by a series of higher highs and higher lows. For the trend to stay intact, the last higher low shouldn’t be traded through.
Conversely, a weak swing point is seen as vulnerable and more likely to be breached. In an uptrend, a peak or area of resistance is expected to be traded through, continuing the trend.
Recognising these points is not just about spotting highs and lows; it's about understanding their context within the market's narrative. They illuminate the path for traders, indicating where the market might head next and highlighting potential areas for a break of structure.
What Is a Break of Structure?
A Break of Structure (BOS) is an integral concept signifying trend continuation rather than its weakening or reversal. In essence, a BOS occurs when, within the context of an uptrend, the market creates a new high beyond the previous peak without breaking the previous low. In other words, the weak resistance has been broken, forming a new high and signalling the bull trend is continuing.
Similarly, in a downtrend, a BOS is identified when a new low is established lower without moving beyond the prior high. This pattern underscores a continuation of the existing direction.
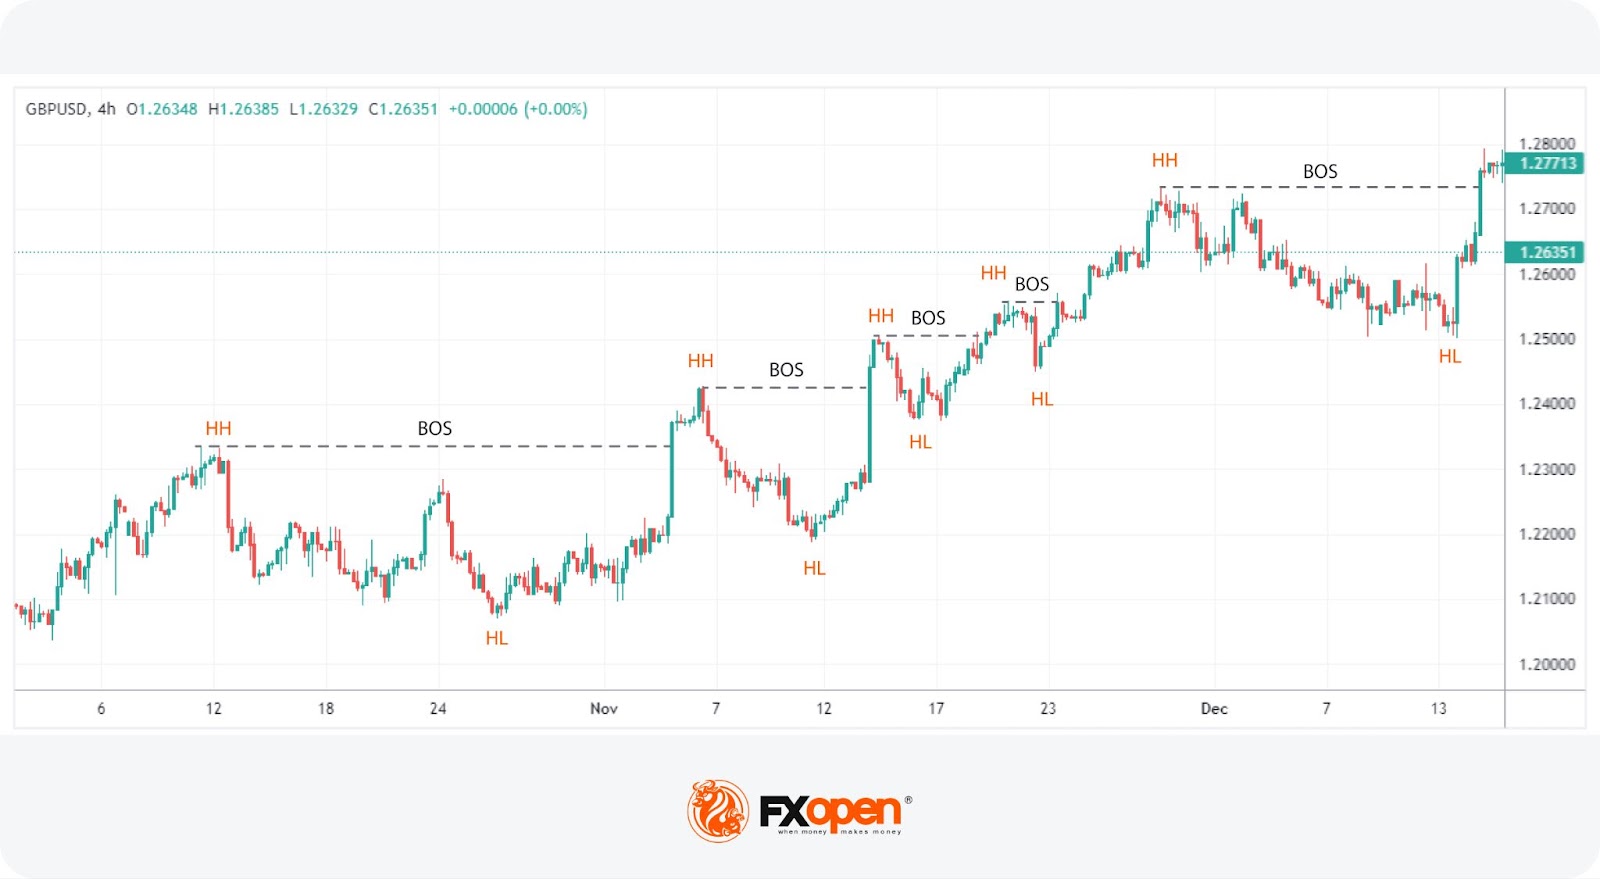
How to Identify a Break of Structure
Identifying a BOS, as dictated by the Break of Structure theory, starts with discerning the current trend through an analysis of existing peaks and troughs. This involves observing whether there are consecutive higher highs and higher lows in an uptrend or lower highs and lower lows in a downtrend.
It's crucial to recognise that structure can vary across different timeframes; a pattern appearing bullish in one may be just a corrective phase within a broader bearish movement on another.
To accurately identify a BOS, traders focus on pinpointing key swing points: the strong swing point, which shouldn't be breached for the trend to remain valid, and the weak swing point, which is expected to be surpassed if the trend continues.
A genuine BOS is confirmed when the price not only trades through but also closes convincingly past the weak swing point, marking a new high or low in the trend. While a wick beyond this point can suggest a BOS, it's considered less reliable and might simply be an attempt at a liquidity grab.
To have a go at identifying your own Break of Structure examples, head over to FXOpen’s free TickTrader platform to access real-time forex, commodity, stock, and crypto* charts.
Break of Structure Trading Strategy
This BOS strategy leverages the natural ebb and flow of trends, capitalising on the continuation patterns that emerge. This approach hinges on the identification of a BOS, followed by strategic positioning to take advantage of the expected trend continuation.
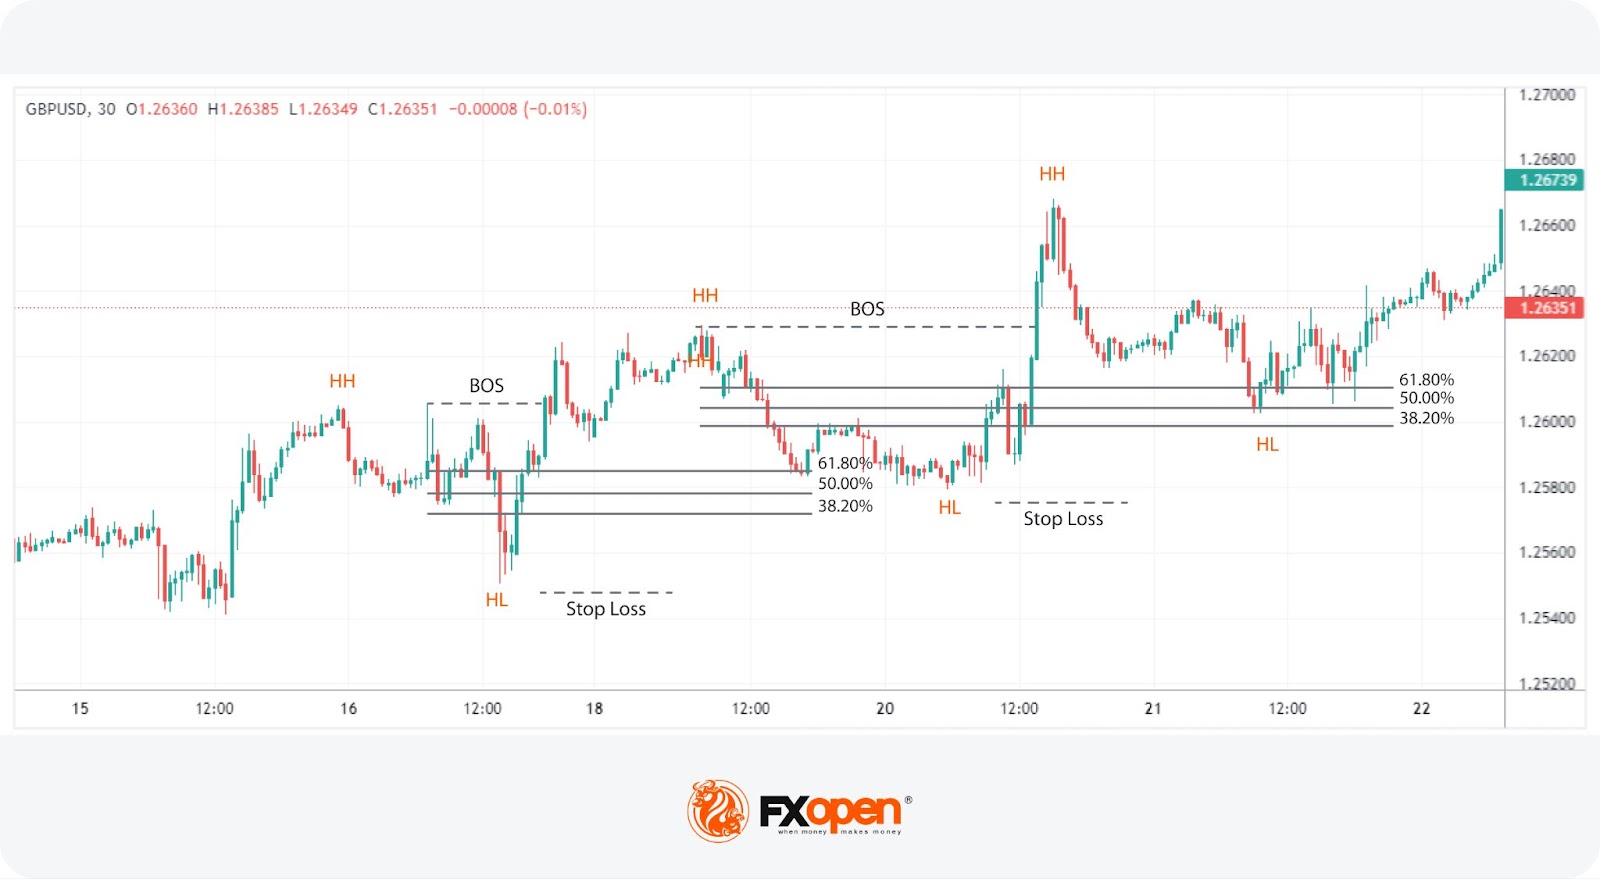
Utilising tools like the Fibonacci retracement between significant points allows traders to pinpoint potential entry zones within the context of a BOS, aligning with key levels where price retracements often stall and reverse back in favour of the prevailing trend.
Entry
- Traders typically identify a BOS in line with the current trend, employing a Fibonacci retracement tool between the high and low (in an uptrend) or low and high (in a downtrend) of the range the BOS originated from.
- They look for potential retracement to the 61.8%, 50%, or 38.2% levels, areas where the price is likely to retrace before continuation. The 50% level serves as a common medium for entry if the retracement depth is uncertain.
Stop Loss
- A stop loss may be placed just below the trough (in an uptrend) or above the peak (in a downtrend) of the swing that prompted the BOS, providing a potential safety net against a reversal.
Take Profit
- Profits may be taken at the previous high or low that initiated the retracement or at another strategic point, like an order block that aligns with the current momentum.
Within the SMC framework, tools like order blocks and imbalances/fair value gaps can complement this strategy. Specifically, if an imbalance exists, there’s a decent probability it’ll be filled before the trend continues. Likewise, the price will often meet an order block before continuing a trend.
In this context, a trader might prefer to set an order at one retracement level, particularly if it aligns with an imbalance fill or order block.
Difference Between a Break of Structure, Change of Character, and Market Structure Shift
Understanding the differences between a Break of Structure (BOS), Change of Character (ChoCh), and Market Structure Shift (MSS) is pivotal for effectively navigating structure.
Break of Structure (BOS)
A BOS indicates a continuation of the current trend. It occurs when the market forms a new top in an uptrend or a new bottom in a downtrend, reinforcing the existing directional momentum. This action signifies strength in the prevailing trend without suggesting a reversal.
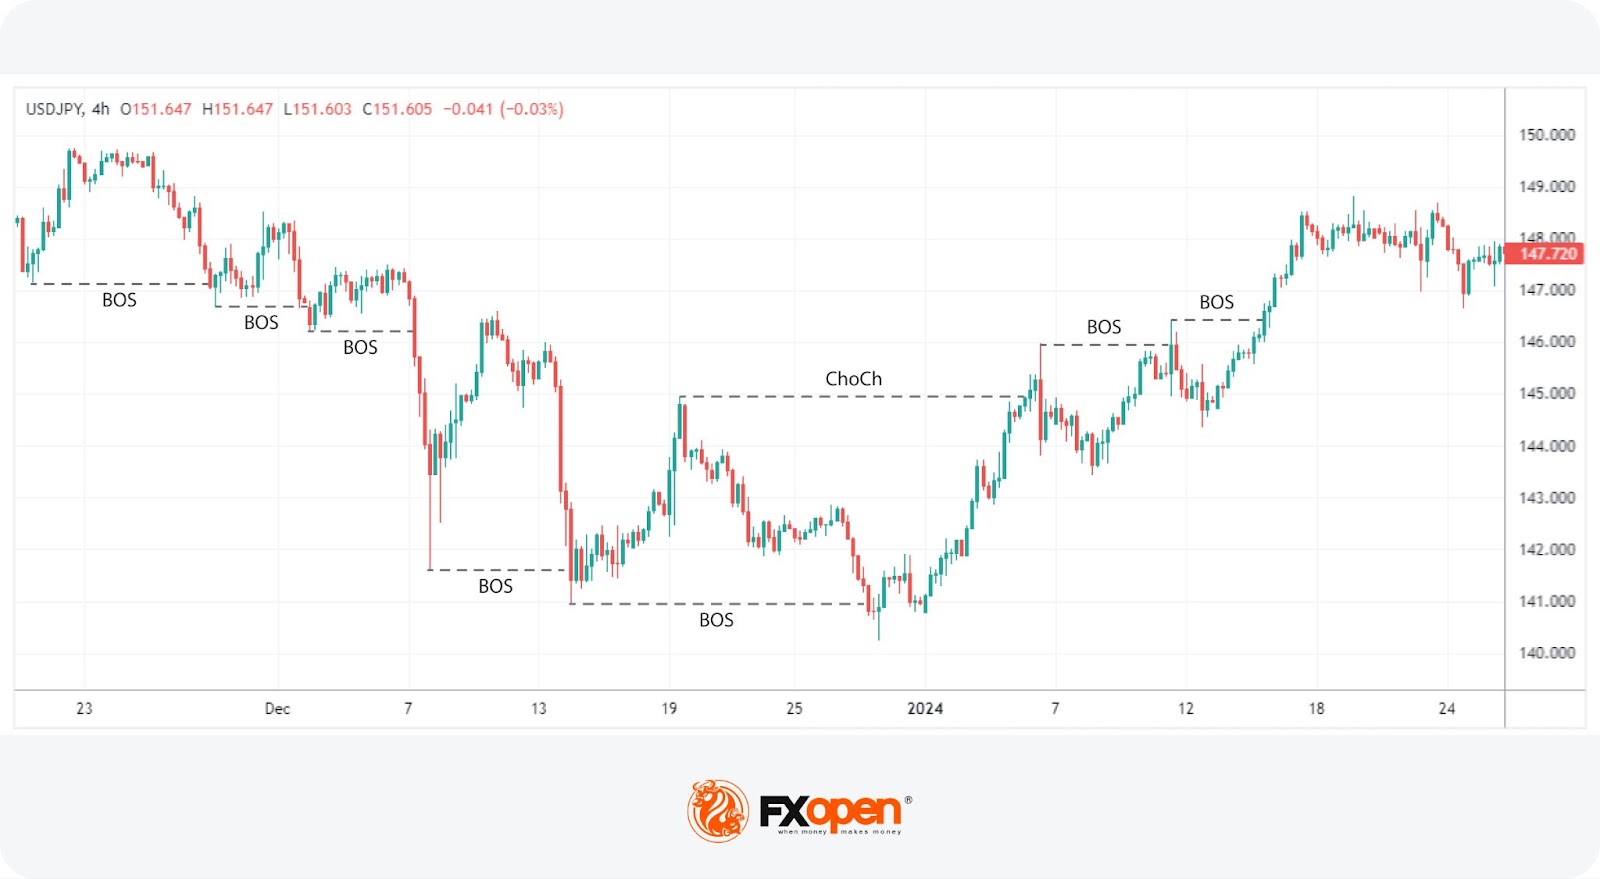
Change of Character (ChoCh)
While a BOS aligns with the trend's direction, a ChoCh represents a break in the opposite direction. It happens when a previously strong swing point, which should act as a barrier to protect the trend, is breached. This breach, especially if it involves a significant swing point, might suggest the onset of a new trend, challenging the current trajectory.
Market Structure Shift (MSS)
An MSS embodies the principles of a ChoCh but with additional confirmation of a potential trend reversal. Before a strong swing point is decisively broken, the market first fails to continue the trend by plotting a higher low (bull) or lower high (bear) but failing to create a higher high or lower low.
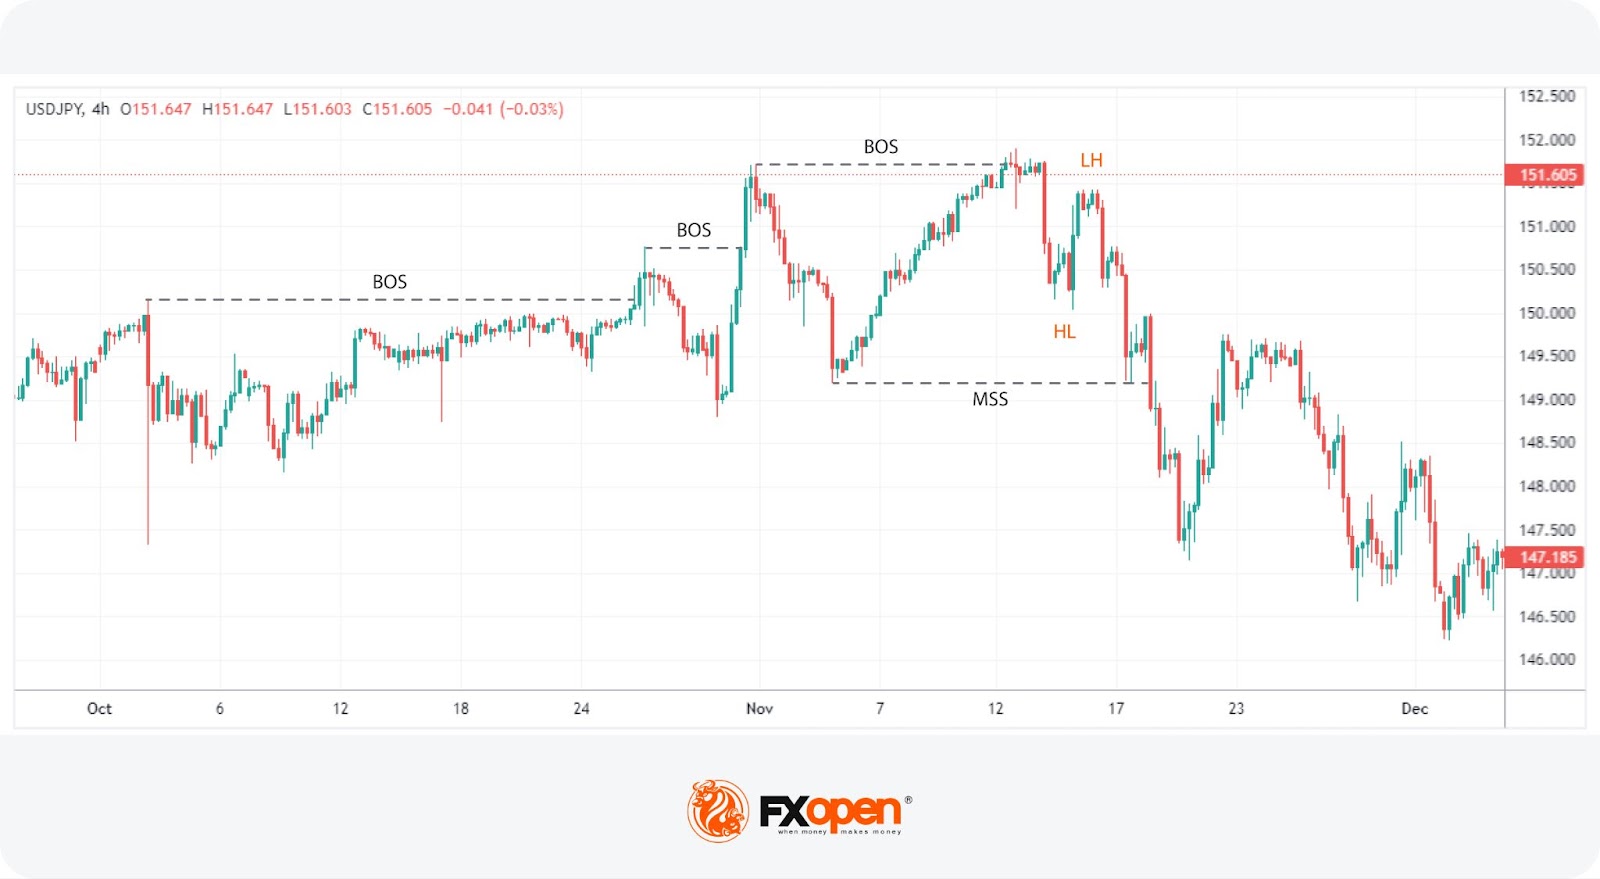
It then proceeds to break a strong swing point with a ‘displacement’ (a strong impulse move) that significantly penetrates through this point. Essentially, an MSS is a comprehensive indication that not only has the trend paused, but a new trend in the opposite direction has begun to establish itself, marked by lower highs in an uptrend or higher lows in a downtrend before the break.
In summary, a BOS aligns with the current trend, a ChoCh hints at a reversal by moving against the trend, and an MSS is a ChoCh that has already started plotting a new direction before strongly breaking through the current trend.
The Bottom Line
Navigating the complexities of structure, particularly the Break of Structure, equips traders with the knowledge to capitalise on trends effectively. By understanding and applying these concepts, traders can refine their strategies for potentially better decision-making. For those looking to put this knowledge into action, opening an FXOpen account offers a gateway to the world of trading, providing the tools needed to explore these strategies in live markets.
FAQs
What Is the Break of Structure in Trading?
A Break of Structure (BOS) in trading refers to a scenario where the market surpasses a previous peak in an uptrend or falls below a previous bottom in a downtrend, indicating the continuation of the current trend. It serves as a signal that the momentum is still in favour of the prevailing trend direction.
How to Identify a Break of Structure?
Identifying a BOS involves observing the formation of new highs or lows within the context of a relevant trend. Traders look for a conclusive move past the most recent significant swing point that aligns with the current direction, often confirmed by a strong closing beyond this point.
What Is the Difference Between BOS and ChoCh?
While a BOS signifies trend continuation by producing new highs or lows, a Change of Character (ChoCh) occurs when the market breaks a significant swing point in the opposite direction of the current trend, potentially indicating the start of a new trend or reversal.
What Is the Difference Between BOS and MSS?
Both BOS and Market Structure Shift (MSS) involve breaking significant points, but an MSS goes a step further. It not only indicates a potential trend reversal, like a ChoCh, but also establishes the beginnings of a new trend by setting a lower high or higher low before breaking through the existing trend's strong swing point, signalling a more definitive shift in market direction.
*At FXOpen UK and FXOpen AU, Cryptocurrency CFDs are only available for trading by those clients categorised as Professional clients under FCA Rules and Professional clients under ASIC Rules, respectively. They are not available for trading by Retail clients.
This article represents the opinion of the Companies operating under the FXOpen brand only. It is not to be construed as an offer, solicitation, or recommendation with respect to products and services provided by the Companies operating under the FXOpen brand, nor is it to be considered financial advice.
Latest from Trader’s Tools
Latest articles

How to Identify and Trade Liquidity Grabs
Understanding the intricacies of market liquidity and the role of liquidity grabs can be crucial for optimising trading strategies. Liquidity grabs, creating rapid price movements, are a key component of Smart Money trading. This article explores how to identify these

What Is a Piercing Line Pattern, and How Can You Trade with It?
In the world of technical analysis, the piercing line pattern stands out as a solid indicator of potential market reversals. This article delves into the nuances of this two-candlestick pattern, exploring its formation, significance, and how traders can effectively leverage

London Calling! FTSE 100 Stocks Flying High Once Again
Back in 2021, which when looking at a physical calendar does not seem such a long time ago yet feels like an epoch ago when considering the changes in global economies and the capital markets since then, the FTSE 100