


FXOpen
Whether you're a seasoned trader or new to the world of commodities, understanding the various available strategies can play an important role in building an effective trading plan. In this article, we’ll explain five commodity trading strategies that you can get started with today.
Commodity Trading Explained
Commodity trading refers to the buying and selling of raw materials and industrial components in the financial markets. While forex trading deals with currencies, commodities trading primarily deals with physical goods. Typically, commodities fall into four broad categories: energy, metals, agricultural, and environmental.
There are many reasons why people buy and sell commodities. Some trade them as a way of hedging against inflation, particularly precious metals. Others might use them to take advantage of a booming economy, as demand for energy, metal, and food usually increases in times of economic growth.
Commodity trading is a practice that dates back thousands of years. In the past, early civilisations had to physically buy and store these goods, but nowadays, there are many types of commodity trading available.
If you’re speculating on commodities in the 21st century, you’re much more likely to be trading contracts for difference (CFDs), the same as we offer at FXOpen. Additionally, you can gain exposure to commodities through stock and exchange-traded fund CFDs, which you’ll also find on our platform.
Understanding CFD Trading in Commodities
Commodity Contracts for Difference (CFDs) are financial derivatives that allow traders to speculate on the price movements of commodities, such as oil, gold, or wheat. They offer traders a way to engage with the commodity market without the need to physically own the underlying assets.
When trading commodity CFDs, traders are essentially entering into an agreement with a broker to exchange the difference in price of a commodity from the time the contract is opened to when it is closed. This method offers the flexibility to take advantage of price movements in both rising and falling markets.
Likewise, CFDs offer leveraged commodities trading. However, it's crucial to note that while leverage is a double-edged sword: it can magnify both potential returns and losses.
How to Create a Commodity Trading Strategy
Creating effective commodity trading strategies requires a deep understanding of the specific market dynamics and fundamental factors influencing commodity prices. Insightful commodity traders scrutinise supply and demand trends, monitor geopolitical events that could impact global trade, and pay close attention to agricultural reports or energy production data.
For instance, weather patterns play a pivotal role in agricultural commodities, affecting crop yields and, consequently, prices. Similarly, political instability in oil-rich regions can lead to fluctuations in oil prices. Understanding these fundamental aspects can help traders anticipate market movements.
Moreover, economic indicators such as inflation rates, currency strength, and GDP growth must be considered, as these can indirectly influence commodity prices. For example, copper is a key component in housing. It’s estimated that around 30% of the global copper supply is used in house construction in China; therefore, Chinese housing data can significantly impact copper trading strategies.
By integrating this knowledge with technical analysis, traders can identify potential entry and exit points. Technical-based strategies, like those below, can complement fundamental analysis and offer a well-rounded approach to commodity markets.
5 Examples of Commodity Trading Strategies
Below, we’ll discuss five technical-based commodity trading techniques. If you’d like to follow along, you can use the TickTrader trading platform. Please note that given the wide spreads usually seen in commodities, it’s preferable to use at least 15-minute charts.
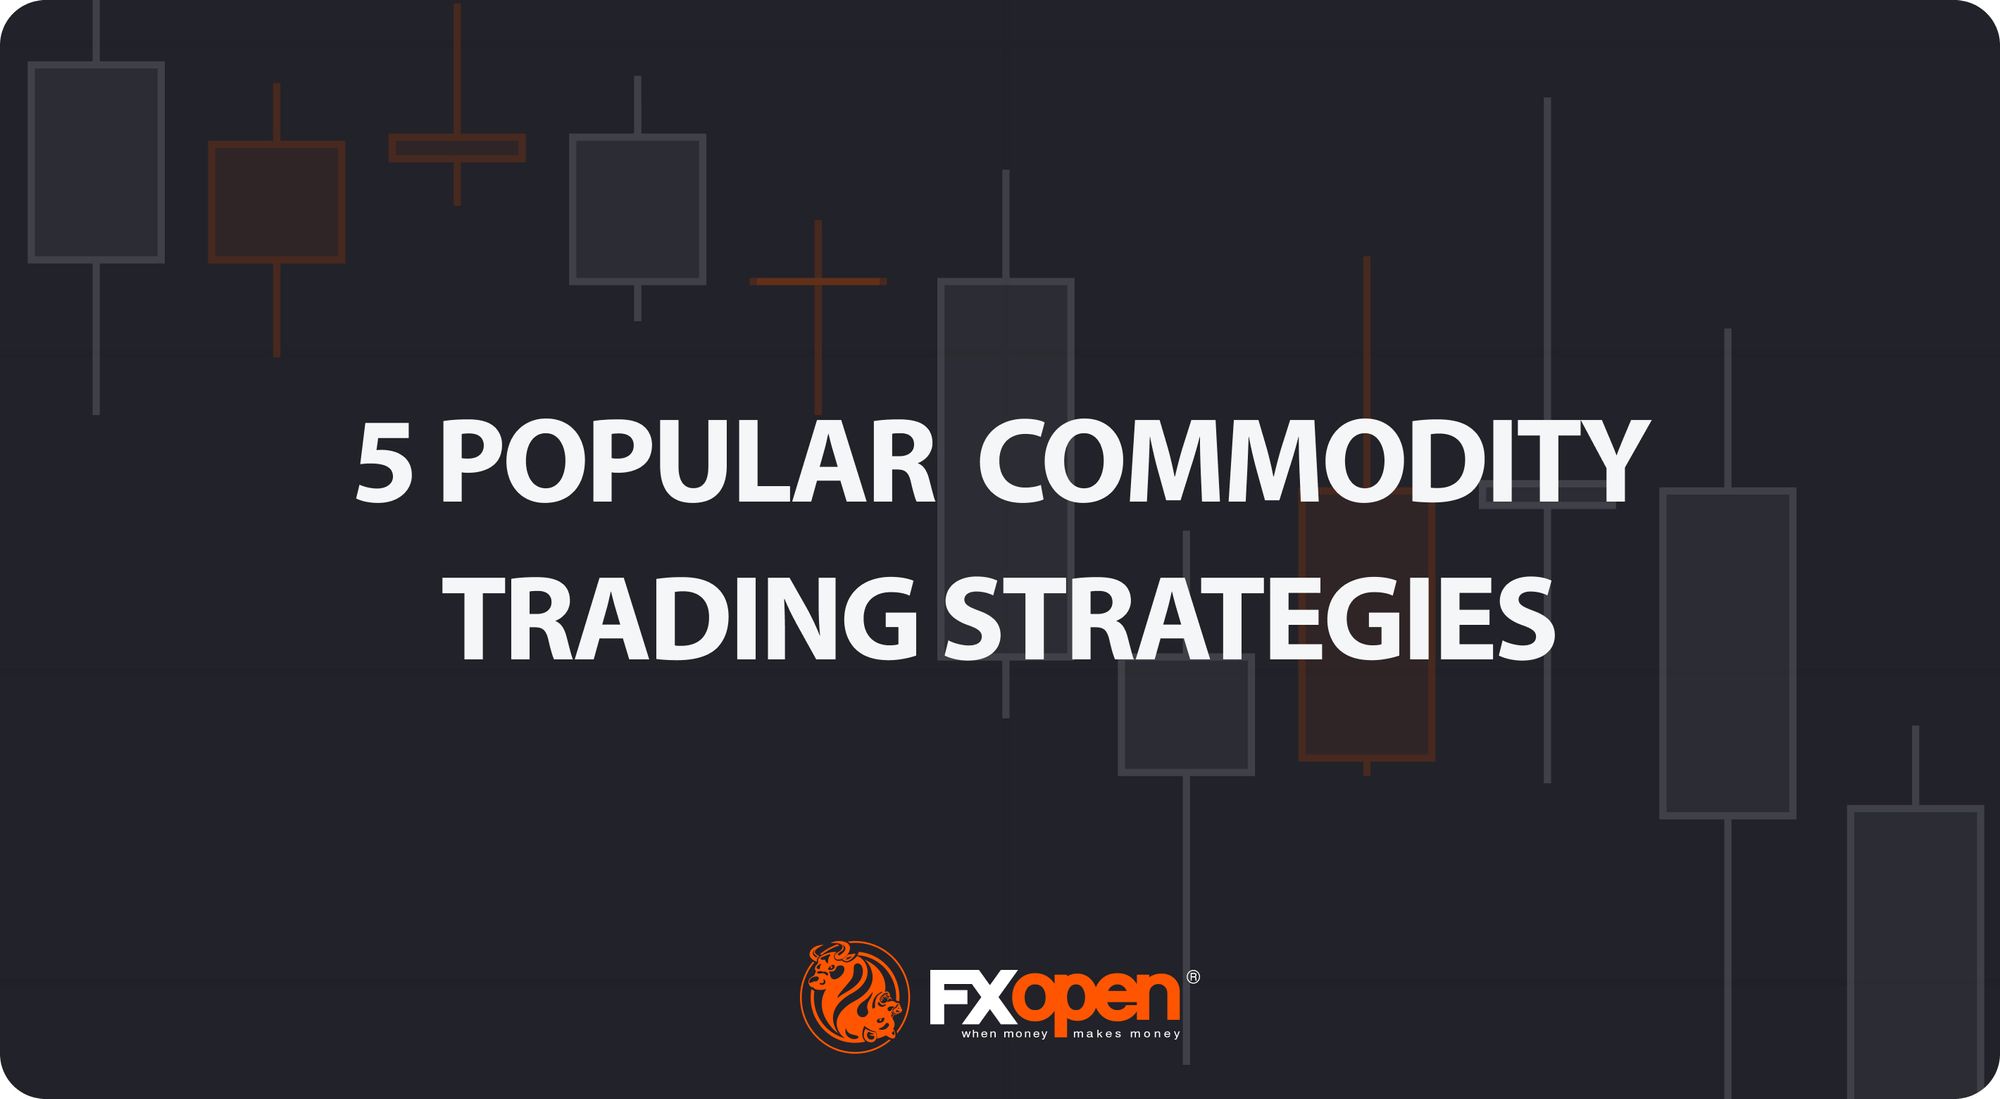
Trading Breakouts: Stop Orders
A breakout refers to the rapid price movements seen after an area of support or resistance is broken. However, trading it is harder than it seems. Often, a “fakeout” - a move beyond a support or resistance level that quickly reverses - can trap traders and put them in the red. Therefore, traders prefer to wait for confirmation and enter with a stop-limit order.
- Entry: Once an area of support or resistance has formed (A), traders wait for the price to break through and create a swing high or low (1). When the price returns to the level, they then wait for an opposing high or low to form (2). Then, they can set a stop-limit order at the previous high or low (1) to catch the confirmed breakout.
- Stop Loss: Traders may set a stop above the swing high or low that creates the retest.
- Take Profit: Traders may take profit at a level that gives them a 1:2 risk/reward ratio. Some prefer to trail their stop, while others might move it to breakeven and manually take profits at the closest areas of support and resistance.
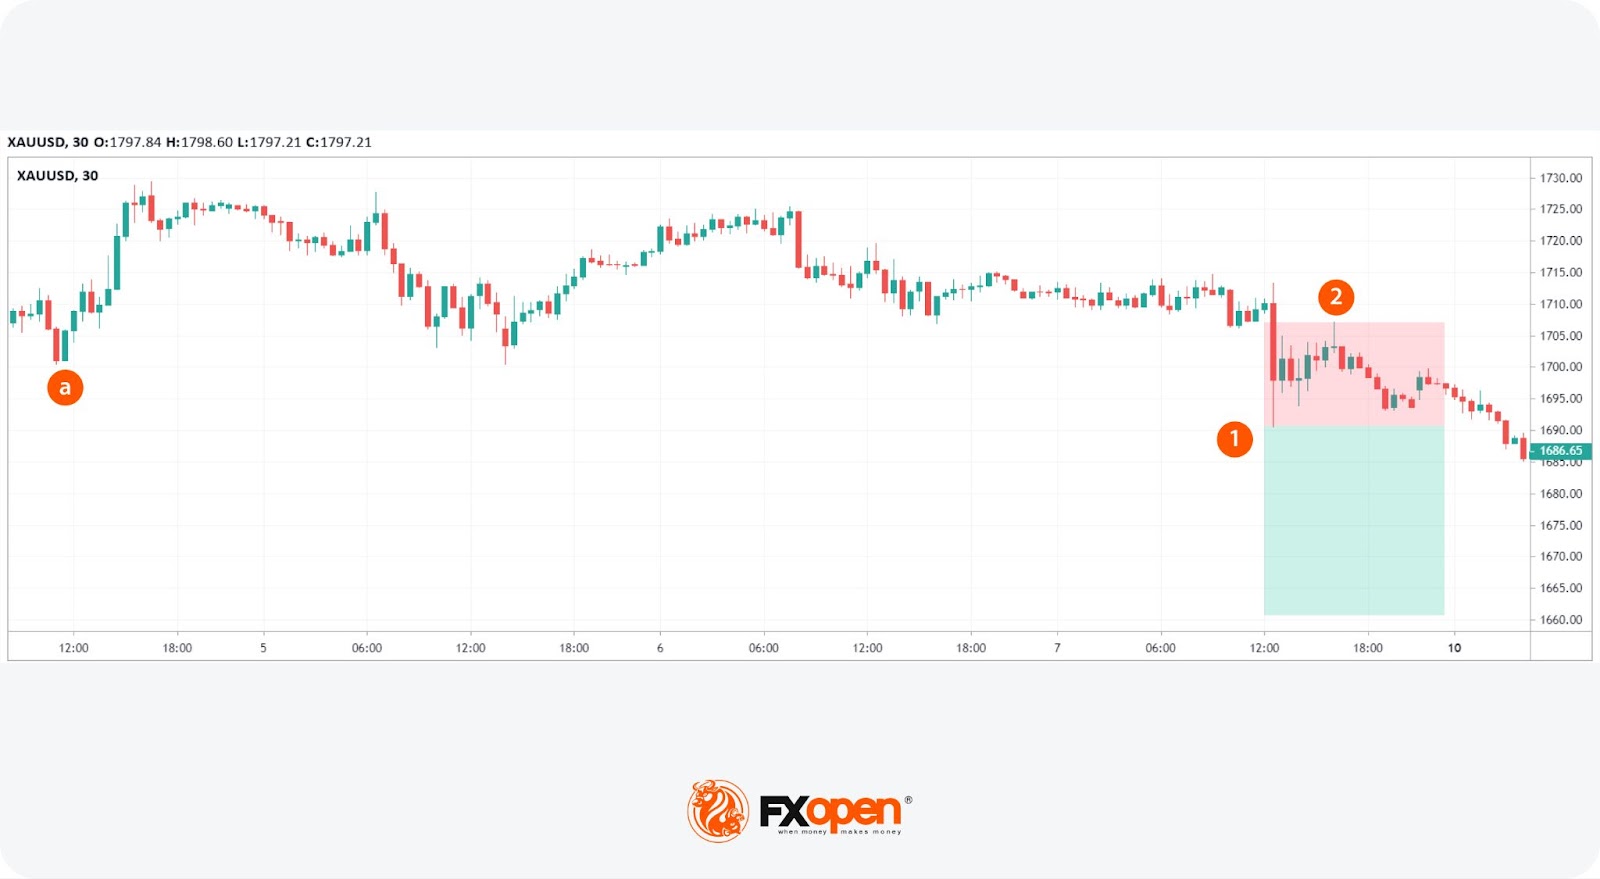
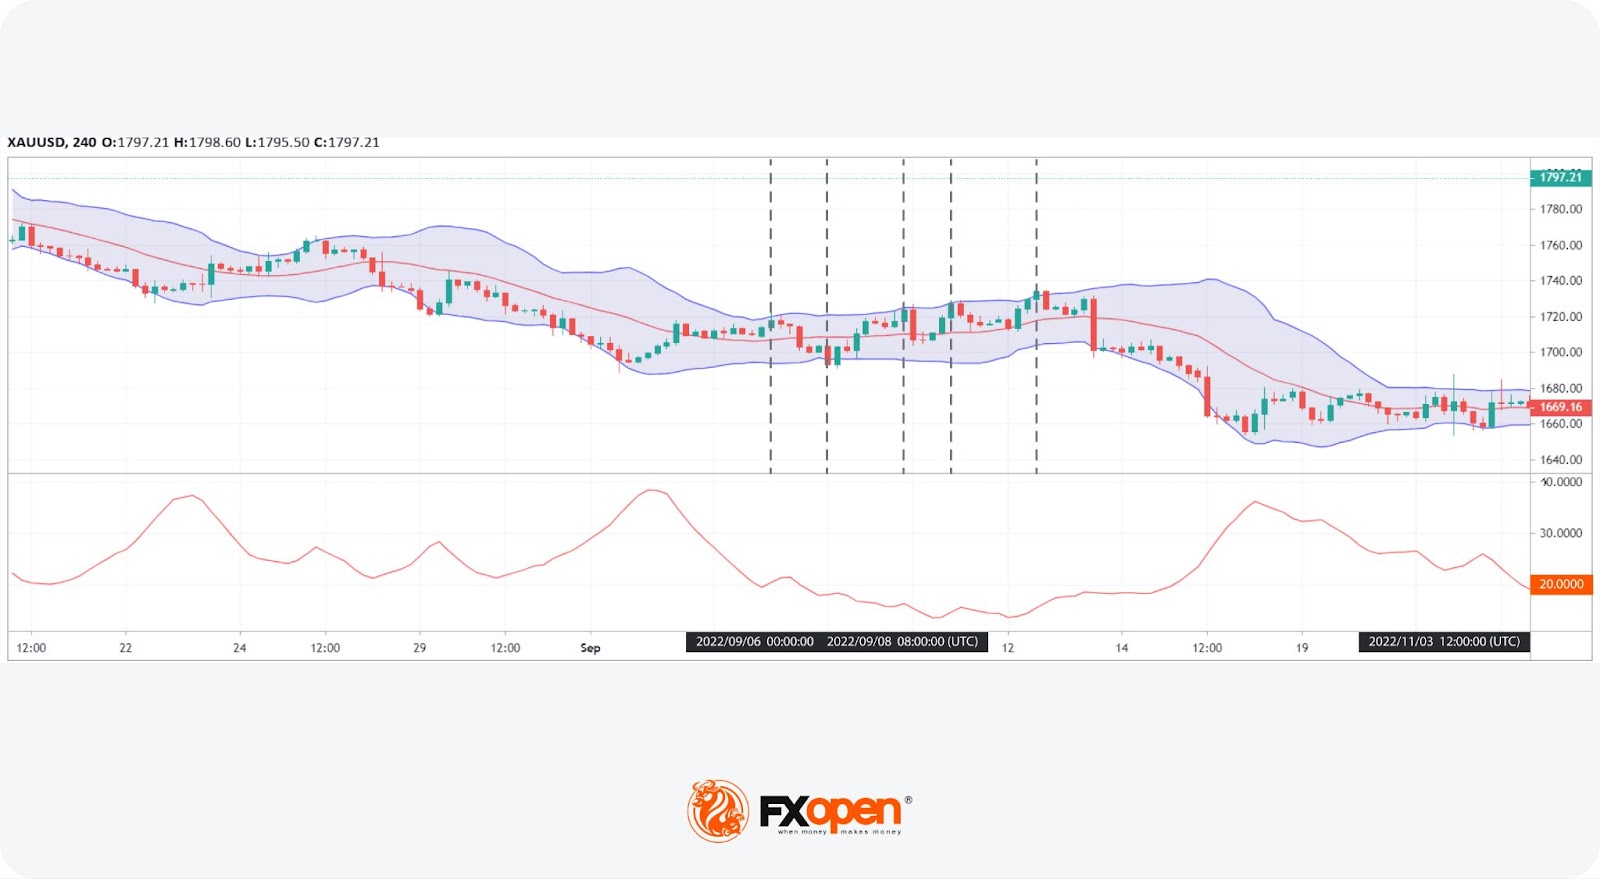
Trading Breakouts: Keltner Channels and Bollinger Bands
However, breakouts can also be captured using two well-known indicators, Keltner Channels and Bollinger Bands, both set with a multiplier of 2. A key signal for traders occurs when Bollinger Bands, an indicator of market volatility, contract within the broader Keltner Channels, suggesting a looming phase of high volatility following a period of consolidation.
- Indicators: Keltner Channels (20, 2) and Bollinger Bands (20, 2).
- Entry: Traders often monitor for a scenario where the Bollinger Bands narrow inside the Keltner Channels, indicating low volatility. A decisive close above or below the Bollinger Band, accompanied by high trading volume and a strong bullish or bearish candle, suggests the initiation of a breakout. An additional confirmation is seen if the price also closes outside the Keltner Channel, reinforcing the breakout's validity.
- Stop Loss: A common approach is to set a stop loss beyond the opposite band or channel line, offering a potential safeguard against reversals.
- Take Profit: Traders might consider taking returns when a reverse setup occurs, e.g., if in a long trade, closing when the price closes below the Bollinger Band after a period of low volatility. Alternatively, employing a trailing stop above or below the band/channel may allow traders to secure the majority of the trend's movement.
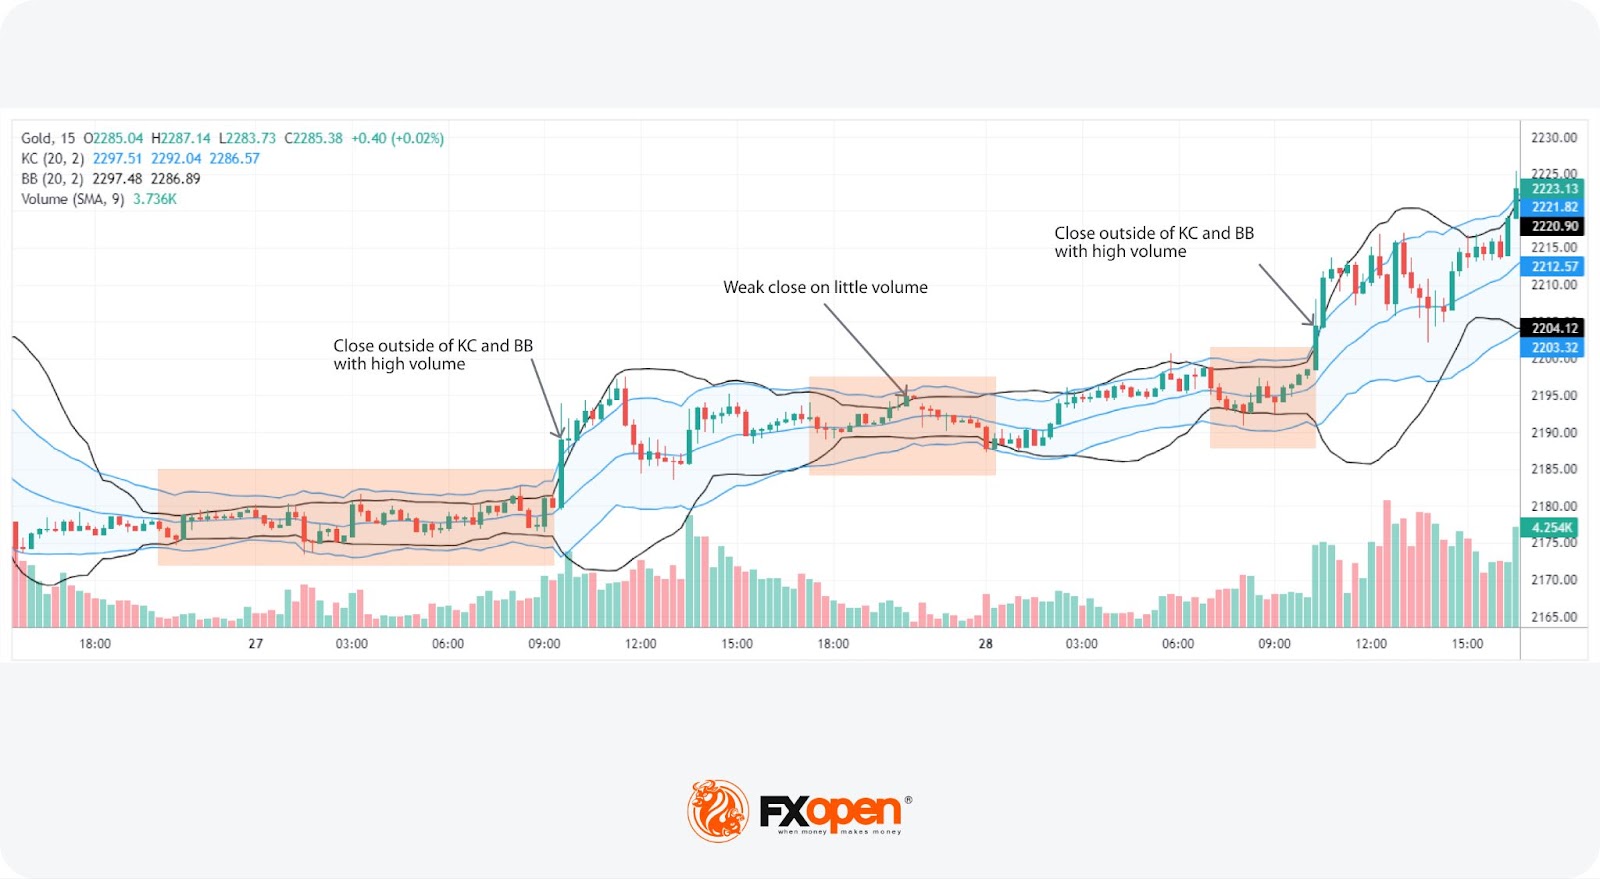
Trading Trends: RSI and EMA
Trend-following strategies can work especially well with commodities, given that their trends can last weeks and even months. This specific strategy uses moving averages to confirm the direction of the trend with additional confluence from the Relative Strength Index (RSI).
- Indicators: RSI (14), Exponential Moving Averages (EMA) of 21 (grey) and 50 (orange).
- Entry: When EMA 21 crosses above EMA 50 and RSI is above 50 (showing bullishness), the first retest of EMA 21 may be considered a long entry point (2). When EMA 21 crosses below EMA 50 and RSI is below 50 (showing bearishness), the first retest of EMA 21 may be considered a short entry point (1).
- Stop Loss: For longs, you could set a stop just below EMA 50 and trail it as the moving average moves up. For shorts, you could set a stop just above EMA 50 and trail it as the moving average moves down.
- Take Profit: Traders may start taking profits at a level that gives them a 1:2 risk/reward ratio. Alternatively, they might take profits when RSI dips below 50 for a long trade or rises above 50 for a short trade.
Trading Trends: Donchian Channels and EMA
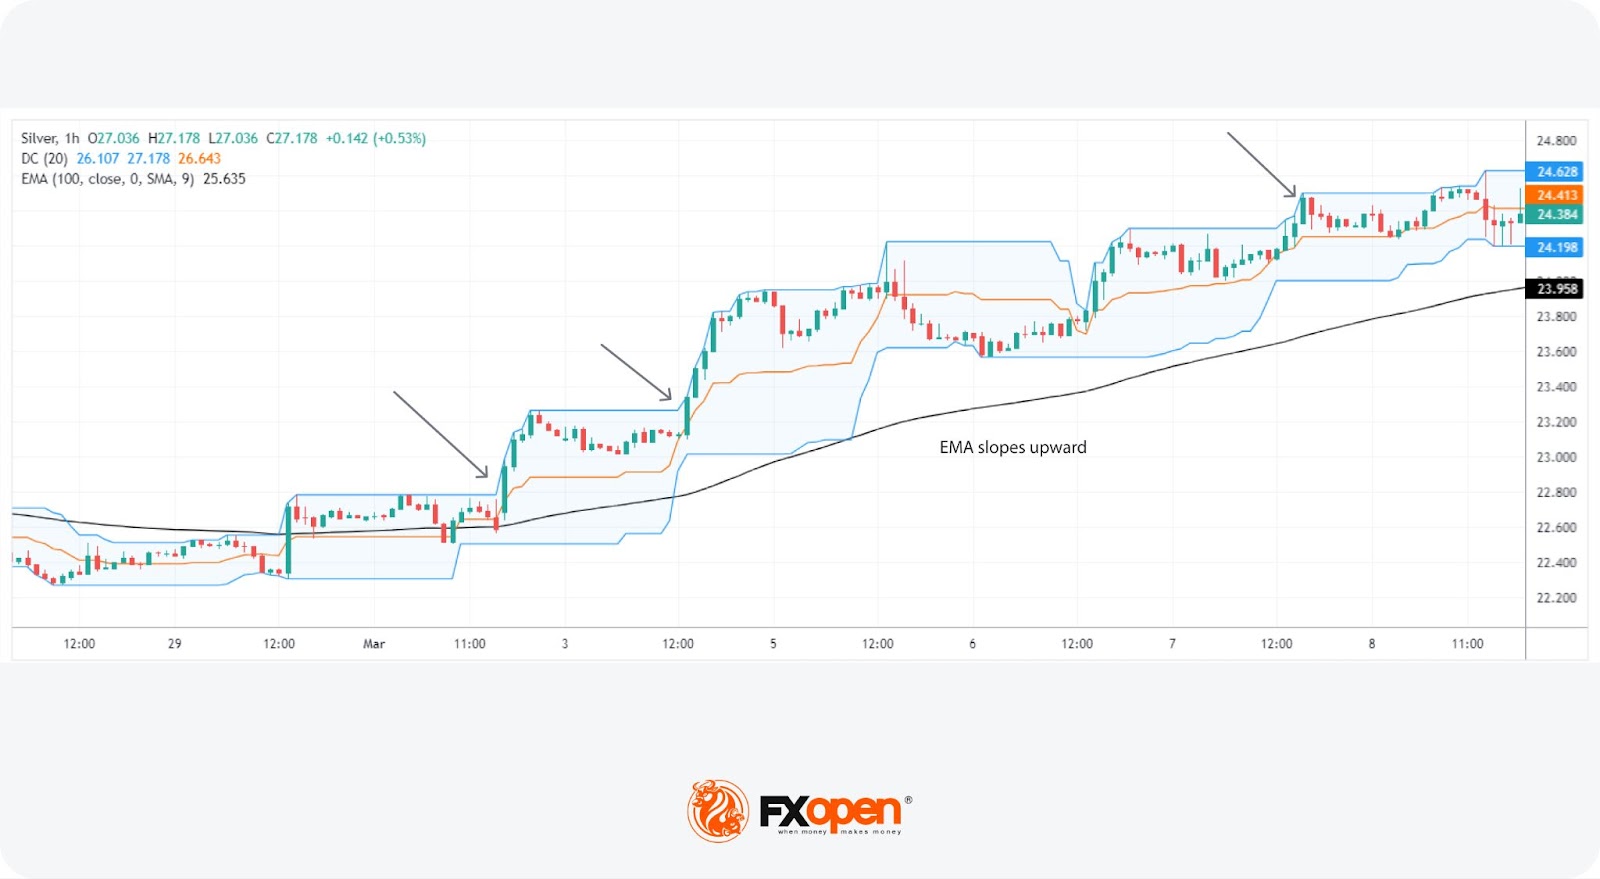
Commodity trading strategies that leverage both trend identification and momentum are highly valued for their potential to capture significant movements. One such strategy incorporates Donchian Channels alongside an EMA to discern the trend's direction and strength. Donchian Channels simply plot the highest high and lowest low over x periods, 20 candles in this case.
The EMA's slope is a trend indicator: an upward slope suggests a bullish trend, while a downward slope indicates bearish conditions. Conversely, a flat EMA means traders remain on the sidelines and await clearer signals.
- Indicators: Donchian Channels (20), EMA (100).
- Entry: Traders often look for the commodity's price to close beyond the last high or low of the Donchian Channel, aligned with the trend indicated by the EMA. A strong close beyond the high or low reflects that the commodity is making a new high or low compared to the past 20 candles, potentially signalling a continuation of the trend.
- Stop Loss: You may place a stop loss beyond the opposite side of the channel to protect against sudden reversals. Another option may be to place it beyond a midpoint line or a nearby swing high or low for a tighter risk management strategy.
- Take Profit: Traders typically consider taking returns when the price touches the opposing band of the Donchian Channel. This touch could indicate that the trend might be losing momentum or reversing, prompting a strategic exit.
Trading Ranges: Bollinger Bands and ADX
While commodities can be exceptionally volatile, like other assets, they also experience ranges. Using volatility-based indicators, like Bollinger Bands, alongside an indicator that tells you whether the price is trending or ranging, like the Average Directional Index (ADX), may help you effectively trade ranges in commodities.
- Indicators: Bollinger Bands (20, 2) and ADX (14, 14).
- Entry: The theory says a trader goes long when ADX is below 20 and the price touches the lower Bollinger Band and goes short when ADX is below 20, but the price touches the upper band.
- Stop Loss: There are a couple of ways to set a stop loss here. One way might be to use a set number of pips. Alternatively, a trader could set a standard deviation of the Bollinger Bands to 3 and use the newly-formed bands as a stop.
- Take Profit: Since this is a range trading strategy, positions could be closed on touching the opposing band, but a trader may choose to leave some in and move their stop at breakeven to potentially be involved when the range breaks out.
Ready to Start Your Commodities Trading Journey?
Now that you have five potential strategies under your belt, it’s time to start thinking about your next steps. If you’re considering testing these strategies in a live market, why not open an FXOpen account? You’ll gain access to a wealth of trading tools in our TickTrader platform, low-cost trading, and lightning-fast execution speeds.
FAQs
How to Trade Commodities?
Trading commodities involves buying and selling raw materials like oil, gold, or wheat on exchanges or through derivatives like futures and CFDs. Traders analyse market trends, supply-demand dynamics, and global economic indicators to make informed decisions. It's crucial to understand the specific factors that influence commodity prices, including geopolitical events, weather patterns, and policy changes.
How to Start Commodity Trading?
To begin trading commodities, it’s best to start by educating yourself about the commodity markets and the factors that influence prices. Opening an account with a broker that offers commodity trading, like FXOpen, and potentially practising with a demo account can provide the ideal environment to practise commodity trading strategies. Lastly, commodity traders continuously monitor market news and analysis to stay informed.
This article represents the opinion of the Companies operating under the FXOpen brand only. It is not to be construed as an offer, solicitation, or recommendation with respect to products and services provided by the Companies operating under the FXOpen brand, nor is it to be considered financial advice.
Latest from Trader’s Tools
Latest articles

How to Identify and Trade Liquidity Grabs
Understanding the intricacies of market liquidity and the role of liquidity grabs can be crucial for optimising trading strategies. Liquidity grabs, creating rapid price movements, are a key component of Smart Money trading. This article explores how to identify these

What Is a Piercing Line Pattern, and How Can You Trade with It?
In the world of technical analysis, the piercing line pattern stands out as a solid indicator of potential market reversals. This article delves into the nuances of this two-candlestick pattern, exploring its formation, significance, and how traders can effectively leverage

London Calling! FTSE 100 Stocks Flying High Once Again
Back in 2021, which when looking at a physical calendar does not seem such a long time ago yet feels like an epoch ago when considering the changes in global economies and the capital markets since then, the FTSE 100