


FXOpen
Understanding the intricacies of order flow trading unlocks the door to deeper market insights, revealing not just the movements of prices but the forces driving them. In this FXOpen article, we’ll explore how order flow works, its components, and how it can be used within three comprehensive trading strategies.
Understanding Order Flow Trading
Understanding order flow in trading involves examining where buy and sell orders might rest in the market. Essentially, it's about understanding the action behind price movements rather than just the movements themselves. At its core, order flow reveals where traders are placing their orders and at what price, offering a glimpse into the potential future direction of the market based on the current levels of buy and sell orders.
When traders talk about order flow, they're looking at the accumulation of these orders at various price levels, which can indicate areas of strong buying or selling pressure.
For instance, a significant number of buy orders at a certain price level might suggest a strong demand at that level, potentially leading to a price increase if sell orders cannot match this buying pressure. Conversely, an abundance of sell orders could indicate a supply level that, if not met with equal buying interest, might drive prices down.
Components of Order Flow Chart Trading
In the realm of trading, dissecting the order flow is akin to peering into the heart of the market, revealing the intentions of traders through the movement of buy and sell orders. Here's a closer examination of the core order flow indicators.
Understanding these components allows traders to interpret order flow directly from the chart, providing insights into where the market might head next based on past and present trader actions.
Order Blocks (Supply and Demand Zones)
In analysing order flow on a chart, order blocks, or supply and demand zones, appear as areas where price action has shown significant movement away from a particular level, indicating a concentration of buy (demand) or sell (supply) orders.
These zones are typically highlighted by a sudden surge or drop in price, leaving behind a footprint where future price often reacts. For example, a demand zone might be identified by a rapid price increase from a specific area, suggesting buyers overpowered sellers significantly.
Most importantly, when the price returns to one of these areas, it’ll typically reverse.
Market Structure/Trends
The market structure, or trend, is visible through the series of highs and lows on a chart. An uptrend is recognised by ascending peaks and troughs, while a downtrend is marked by descending peaks and troughs. These structures show order flow traders the prevailing direction of market sentiment.
Imbalances
Imbalances manifest as large, directional candles that break away from a consolidation area, signifying a sudden imbalance between buyers and sellers, usually with little to no pullbacks. These are often accompanied by increased volume, which may suggests a strong commitment from traders to move the price in a specific direction.
Volume
Volume is directly observable on a chart, usually depicted as bars beneath the price action. High volume bars accompanying significant price moves validate the strength of that move, implying a robust interest from the market in that price level. Conversely, low volume may indicate a lack of conviction, suggesting that the price move may not be sustainable.
Interested readers can learn more about these components and how they interact with each other in our comprehensive article on order flow analysis.
Order Flow Trading Strategy: Three Examples
Let’s now take a look at how these components can be used in three order flow trading strategies. Consider applying them to real-time charts in FXOpen’s free TickTrader platform to gain the deepest understanding.
Liquidity Sweep at Order Block/Supply or Demand Zone
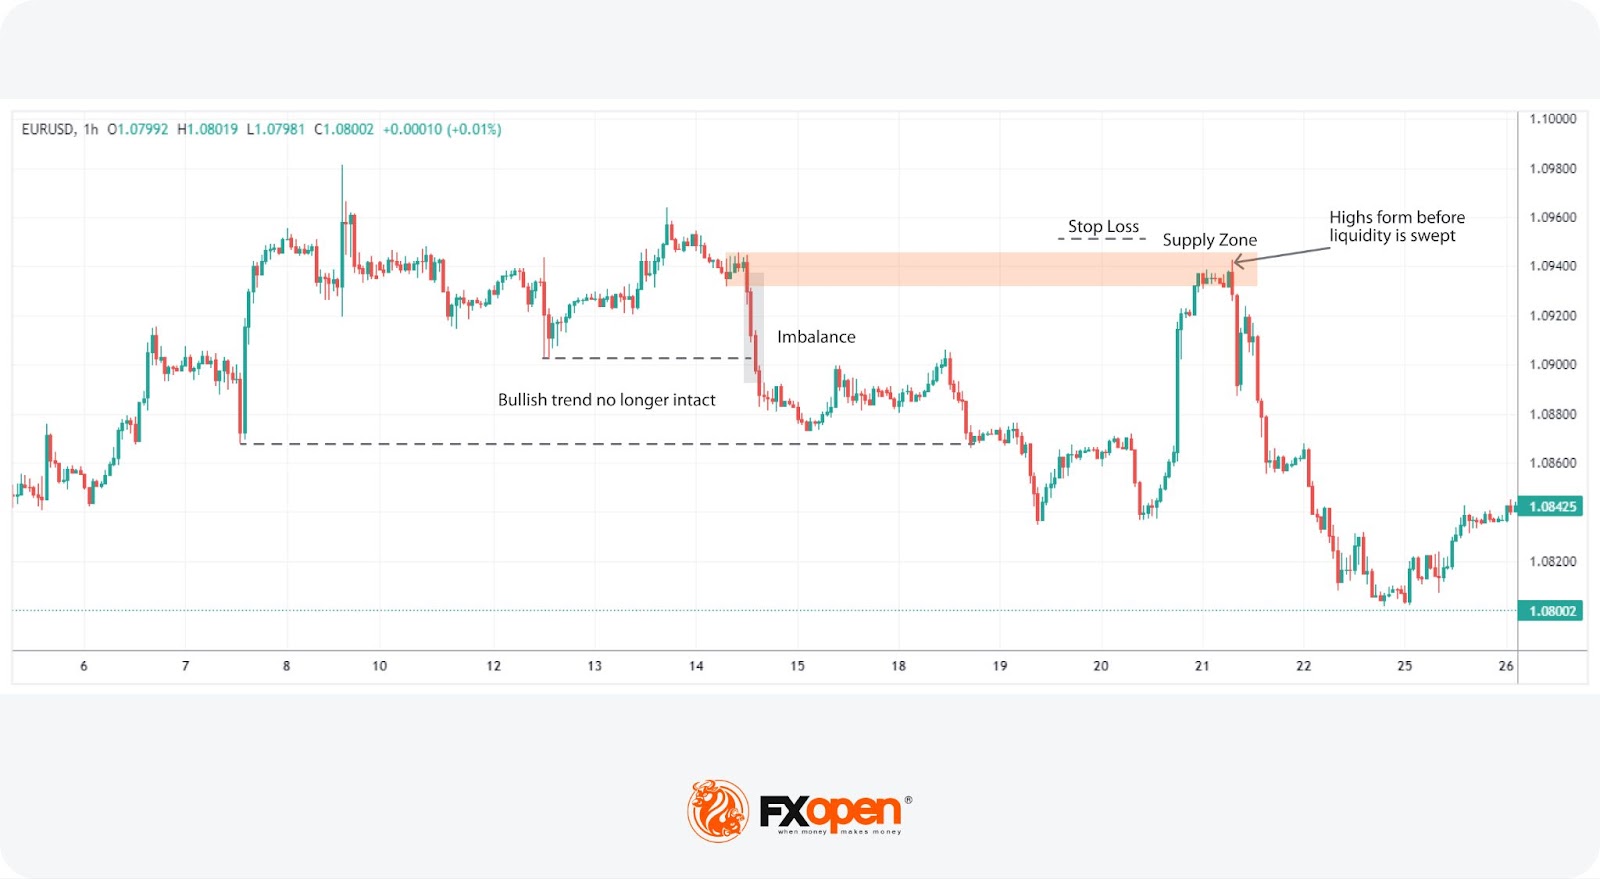
The concept of a liquidity sweep within an order block stands out for its nuanced approach to capitalising on market reversals. This strategy hinges on the premise that price movements in these critical zones often preclude a significant direction change, making them ripe for reversal entries.
However, while leaving a simple limit order at these areas may be tempting, unforeseen news or a strong trend can cause the price to trade beyond it. Therefore, the theory states that looking for confirmation is often best. Using the idea of a liquidity sweep or a bull/bear trap, traders can identify higher probability setups in these areas.
Entry
- Traders typically identify an order block, marking zones that prompted a significant imbalance and strong directional price move.
- Watching for the price to approach these zones is key, with a keen eye on the price action within the zone for signals of a potential reversal.
- The formation of new highs in a supply zone or lows in a demand zone accompanied by a liquidity sweep (a brief breach of these highs/lows followed by a quick return) may serve as a trigger for entry.
- The appearance of reversal patterns, like a shooting star, hammer, or engulfing candlestick, may indicate the market's rejection of prices beyond the zone.
Stop Loss
- Placing a stop loss just beyond the boundary of the supply or demand zone potentially safeguards against the risk of a genuine breakout.
Take Profit
- Profit targets may be set at the nearest opposing supply or demand zone, usually where another significant imbalance lies, offering a strategic exit point.
Moving Average Crossover at Order Block/Supply or Demand Zone
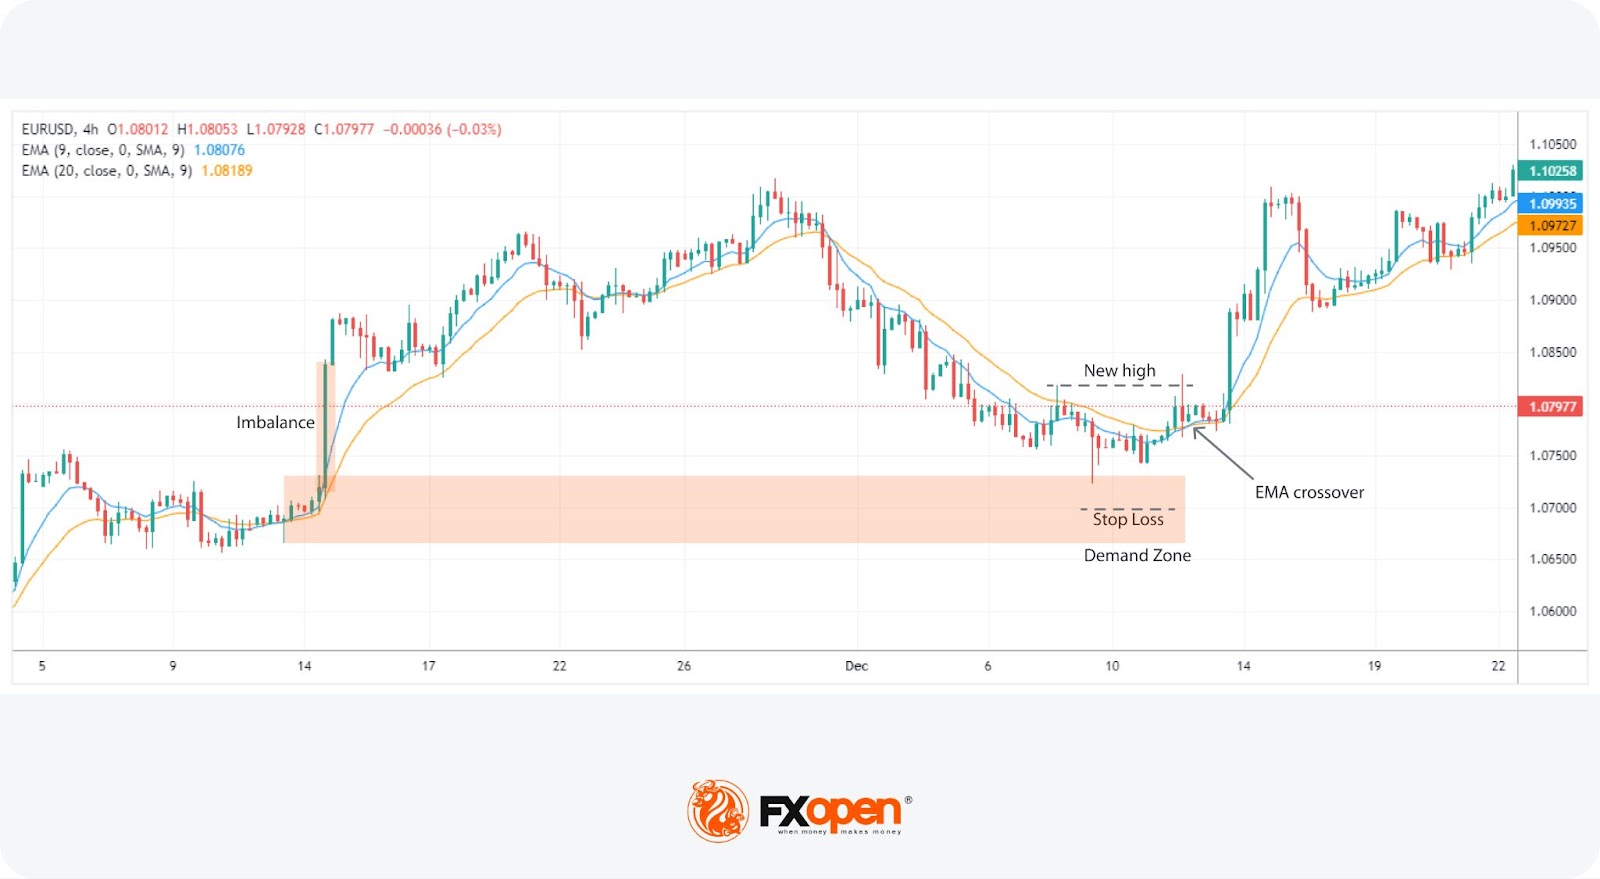
Integrating moving averages into the analysis of order blocks or supply/demand zones offers traders a quantitative lens through which market sentiment can be gauged more precisely. This strategy particularly revolves around the utilisation of two moving averages.
We’ve used Exponential Moving Averages (EMAs) with periods of 9 and 20, leveraging their sensitivity to price movements to identify potential reversal points within these critical market zones. However, traders can use whichever type or length they prefer, though a balance should be struck between responsiveness and mitigating false signals.
Entry
- The trader identifies an order block where a substantial move has previously occurred, leaving behind a noticeable imbalance in the price chart.
- As the price revisits this zone, attention is directed towards the EMAs' behaviour. For instance, a crossover of the 9-period EMA above the 20-period EMA signals bullish momentum, whereas its crossover below the 20-period EMA reflects bearish momentum.
- Entry may be considered once the moving average crossover aligns with the anticipated direction of the reversal, indicating a strengthening trend.
- This signal may be further validated if accompanied by a liquidity sweep or specific candlestick patterns within the zone, potentially enhancing the conviction of the trade.
Stop Loss
- A stop loss could be placed beyond the zone’s extremes.
- Given the added confidence from the moving average crossover, the stop loss could also be positioned just beyond the most extreme high or low when the price entered the zone.
Take Profit
- The take-profit target may be set at an opposing supply or demand zone. Such zones are anticipated to act as natural barriers where the next significant price reaction could occur.
Impulse and Correction Stop Order
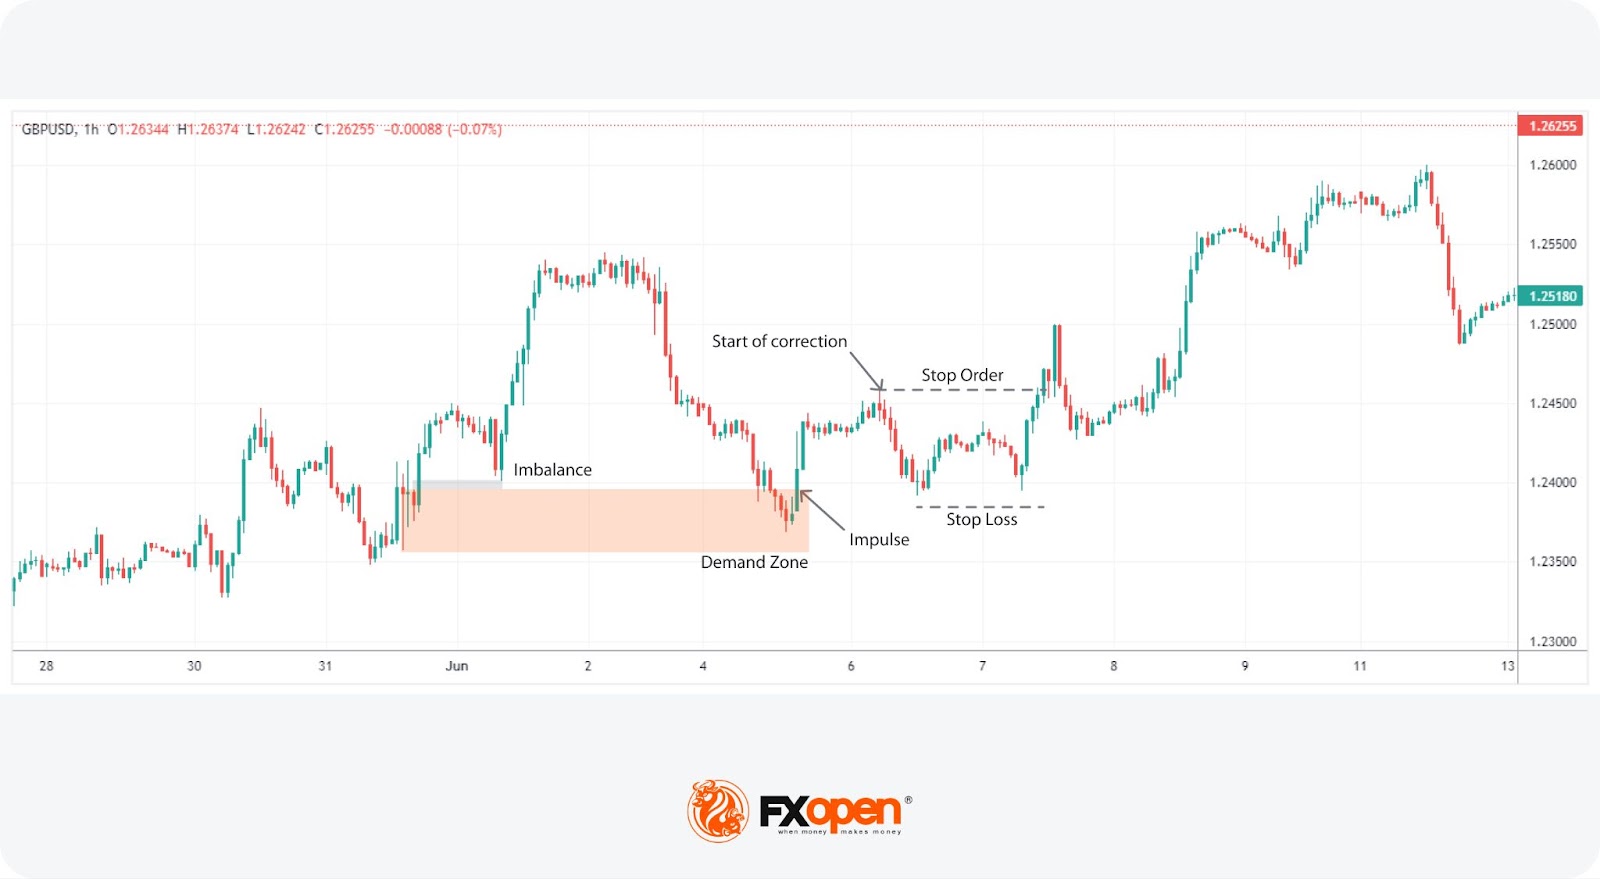
The Impulse and Correction Stop Order strategy leverages the dynamic reaction of prices at supply or demand zones, focusing on the price action that follows these pivotal areas.
Recognising that initial reactions from these zones can be sharp, signalling strong market rejection, this approach waits for a pullback or correction as a secondary entry point. This method suits traders looking to capitalise on the momentum shift or those who may have missed the primary reversal opportunity within the zone.
Entry
- Traders monitor for a pronounced impulse move away from a supply or demand zone, indicating strong market rejection of these levels.
- A subsequent pullback or correction phase is observed, ideally filling the imbalance left by the initial impulse. This correction signals the market's natural attempt to retest the zone before a potential markup or markdown begins.
- A stop order may be set at the low (for bearish setups) or high (for bullish setups) that initiated the correction. This positioning aims to capture the breakout moment that confirms the market's commitment to the new direction.
Stop Loss
- The stop loss may be placed beyond the correction. This placement is strategic, potentially minimising loss if the anticipated breakout does not materialise and the correction reverses direction.
Take Profit
- The take-profit point may be chosen within a suitable opposing zone, considering the optimal risk/reward ratio or strong support/resistance levels.
The Bottom Line
In essence, the realm of order flow trading offers a rich tapestry of insights, enabling traders to navigate the market with a more informed perspective. Through the application of these strategies, traders can potentially align themselves with the underlying momentum of the market.
For those looking to dive deeper into these strategies and apply them in real-time market conditions, opening an FXOpen account provides access to a platform where such sophisticated analyses can be executed, bridging the gap between theory and practical trading.
FAQs
What Is Order Flow in Trading?
Order flow represents the myriad of buy and sell orders executed in the market. It acts as a snapshot of market sentiment, showing where and how traders are placing their orders, which in turn influences price movements.
How to Read Order Flow?
Reading order flow involves analysing the data on the volume of trades, the price levels at which they are executed, and the type of orders (buy or sell). Traders often use specialised software that visualises these data points, though they can be identified on charts through the use of order blocks and imbalances.
How to Trade Order Flow?
Trading order flow typically involves looking for signs of imbalance between buy and sell orders and trading from order blocks. Traders often enter positions based on the anticipation that price will fill these imbalances and reverse from order blocks.
Why Is Order Flow Important in Trading?
Order flow is important because it provides insights into the immediate direction of the market, revealing the underlying demand and supply dynamics, which can be key for making informed trading decisions.
What Is the Difference Between Order Flow and Volume?
While closely related, order flow technically refers to the detailed list of transactions (buy and sell), whereas volume measures the quantity of an asset traded over a period. Order flow gives insight into the specifics of market transactions, while volume indicates the level of activity.
What Is the Difference Between Order Flow and Price Action Trading?
Order flow trading focuses on the underlying transactions that drive market movements, whereas price action trading relies on analysing the price movements themselves. Price action traders study charts for patterns and trends without necessarily considering the specific buy and sell orders that cause those movements.
This article represents the opinion of the Companies operating under the FXOpen brand only. It is not to be construed as an offer, solicitation, or recommendation with respect to products and services provided by the Companies operating under the FXOpen brand, nor is it to be considered financial advice.
Latest from Trader’s Tools
Latest articles

How to Identify and Trade Liquidity Grabs
Understanding the intricacies of market liquidity and the role of liquidity grabs can be crucial for optimising trading strategies. Liquidity grabs, creating rapid price movements, are a key component of Smart Money trading. This article explores how to identify these

What Is a Piercing Line Pattern, and How Can You Trade with It?
In the world of technical analysis, the piercing line pattern stands out as a solid indicator of potential market reversals. This article delves into the nuances of this two-candlestick pattern, exploring its formation, significance, and how traders can effectively leverage

London Calling! FTSE 100 Stocks Flying High Once Again
Back in 2021, which when looking at a physical calendar does not seem such a long time ago yet feels like an epoch ago when considering the changes in global economies and the capital markets since then, the FTSE 100