


FXOpen
Hong Kong enjoyed a sterling reputation for an entire century as a highly polished, utterly stable mantlepiece upon which global corporations could comfortably sit and where an international talent base could reside in fabulous surroundings and approach European, American, African and Asian markets with aplomb.
Its financial markets economy has been recognized as one of the most developed in the world to the extent that despite its tiny size, it has its own reserve currency, which is a bastion of fiscal might on the world stage.
These days, however, things are somewhat different as the independent nature of Hong Kong is now a fading memory, and its return to governance under the auspices of mainland China is now widely accepted.
Having conceded its position as the world's meeting place to other global cities such as Singapore and Dubai, Hong Kong has gone through a sea change over recent years, which is reflected in its stock market performance.
At the beginning of 2024, it had become clear that several decades of wealth generation among Hong Kong-based businesses had been eroded since the realm of power was handed back to China, with the stock market being valued at a lower point than when Hong Kong's British era ended in 1997 at the expiry of the lease at which point Hong Kong became a Special Administrative Region of China.
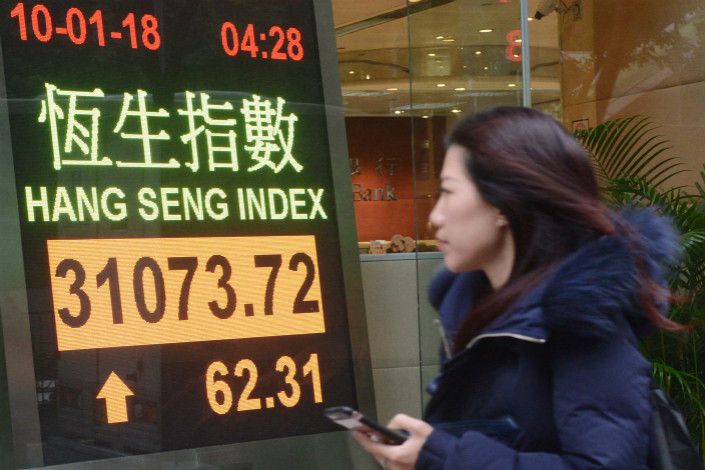
That is quite some depreciation. Since the beginning of this year, however, swathes of volatility have been clearly apparent in Hong Kong's Hang Seng 50 Index.
Going back over the years, performance has been incredibly volatile, to say the least. Back in 2022, the variations were simply incredible. On January 6 that year, the Hang Seng 50 index was at 21869.8 points according to FXOpen pricing. However, this plunged dramatically to 14,849 just four days later on January 10.
A similar situation took place at the beginning of last year; however, by January 2024, stock prices in Hong Kong were not only at a very low point but also stagnant.
The Hang Seng 50 index began the year at 15,588.7 on January 1, according to FXOpen pricing, but has been gradually rising rather than fluctuating dramatically such as has been the case in the beginning quarters of the past few years.
By 8.30 am UK time, after much of the Asia Pacific region's trading session had concluded, The Hang Seng 50 index was trading at 16,597.7, which of course, is a way down from the aforementioned high points experienced during the volatility bouts of 2022 and 2023, but this places the Hang Seng 50 index firmly in the category of today's top risers across global stock markets.
It appears that market participants are still concerned about over-exposure within the Chinese property market and construction industries, but overall the wild ride that preceded seems to have given way to a slump that is now being steadily recovered, making the Hang Seng 50 an overall steady performer within the global stock markets, an accolade it perhaps would not have warranted at any period over the past few years.
Trade global index CFDs with zero commission and tight spreads. Open your FXOpen account now or learn more about trading index CFDs with FXOpen.
This article represents the opinion of the Companies operating under the FXOpen brand only. It is not to be construed as an offer, solicitation, or recommendation with respect to products and services provided by the Companies operating under the FXOpen brand, nor is it to be considered financial advice.
Latest articles
How to Identify and Trade Liquidity Grabs
Understanding the intricacies of market liquidity and the role of liquidity grabs can be crucial for optimising trading strategies. Liquidity grabs, creating rapid price movements, are a key component of Smart Money trading. This article explores how to identify these
What Is a Piercing Line Pattern, and How Can You Trade with It?
In the world of technical analysis, the piercing line pattern stands out as a solid indicator of potential market reversals. This article delves into the nuances of this two-candlestick pattern, exploring its formation, significance, and how traders can effectively leverage
London Calling! FTSE 100 Stocks Flying High Once Again
Back in 2021, which when looking at a physical calendar does not seem such a long time ago yet feels like an epoch ago when considering the changes in global economies and the capital markets since then, the FTSE 100