


FXOpen
On April 4, we wrote that the S&P 500 is showing signs of weakness around the 5,250 level. How is the situation on the stock market developing by today, which is the start of the reporting season for the first quarter?
The S&P 500 fell sharply on Wednesday amid higher-than-expected inflation data.
But the S&P 500 rose yesterday after data showed producer prices rose only slightly in March.
According to Forexfactory:
→ Producer Price Index (PPI) in monthly terms: actual = 0.2%, forecast = 0.3%, a month ago = 0.6%;
→ Core PPI in monthly terms: actual = 0.2%, forecast = 0.2%, a month ago = 0.3%.
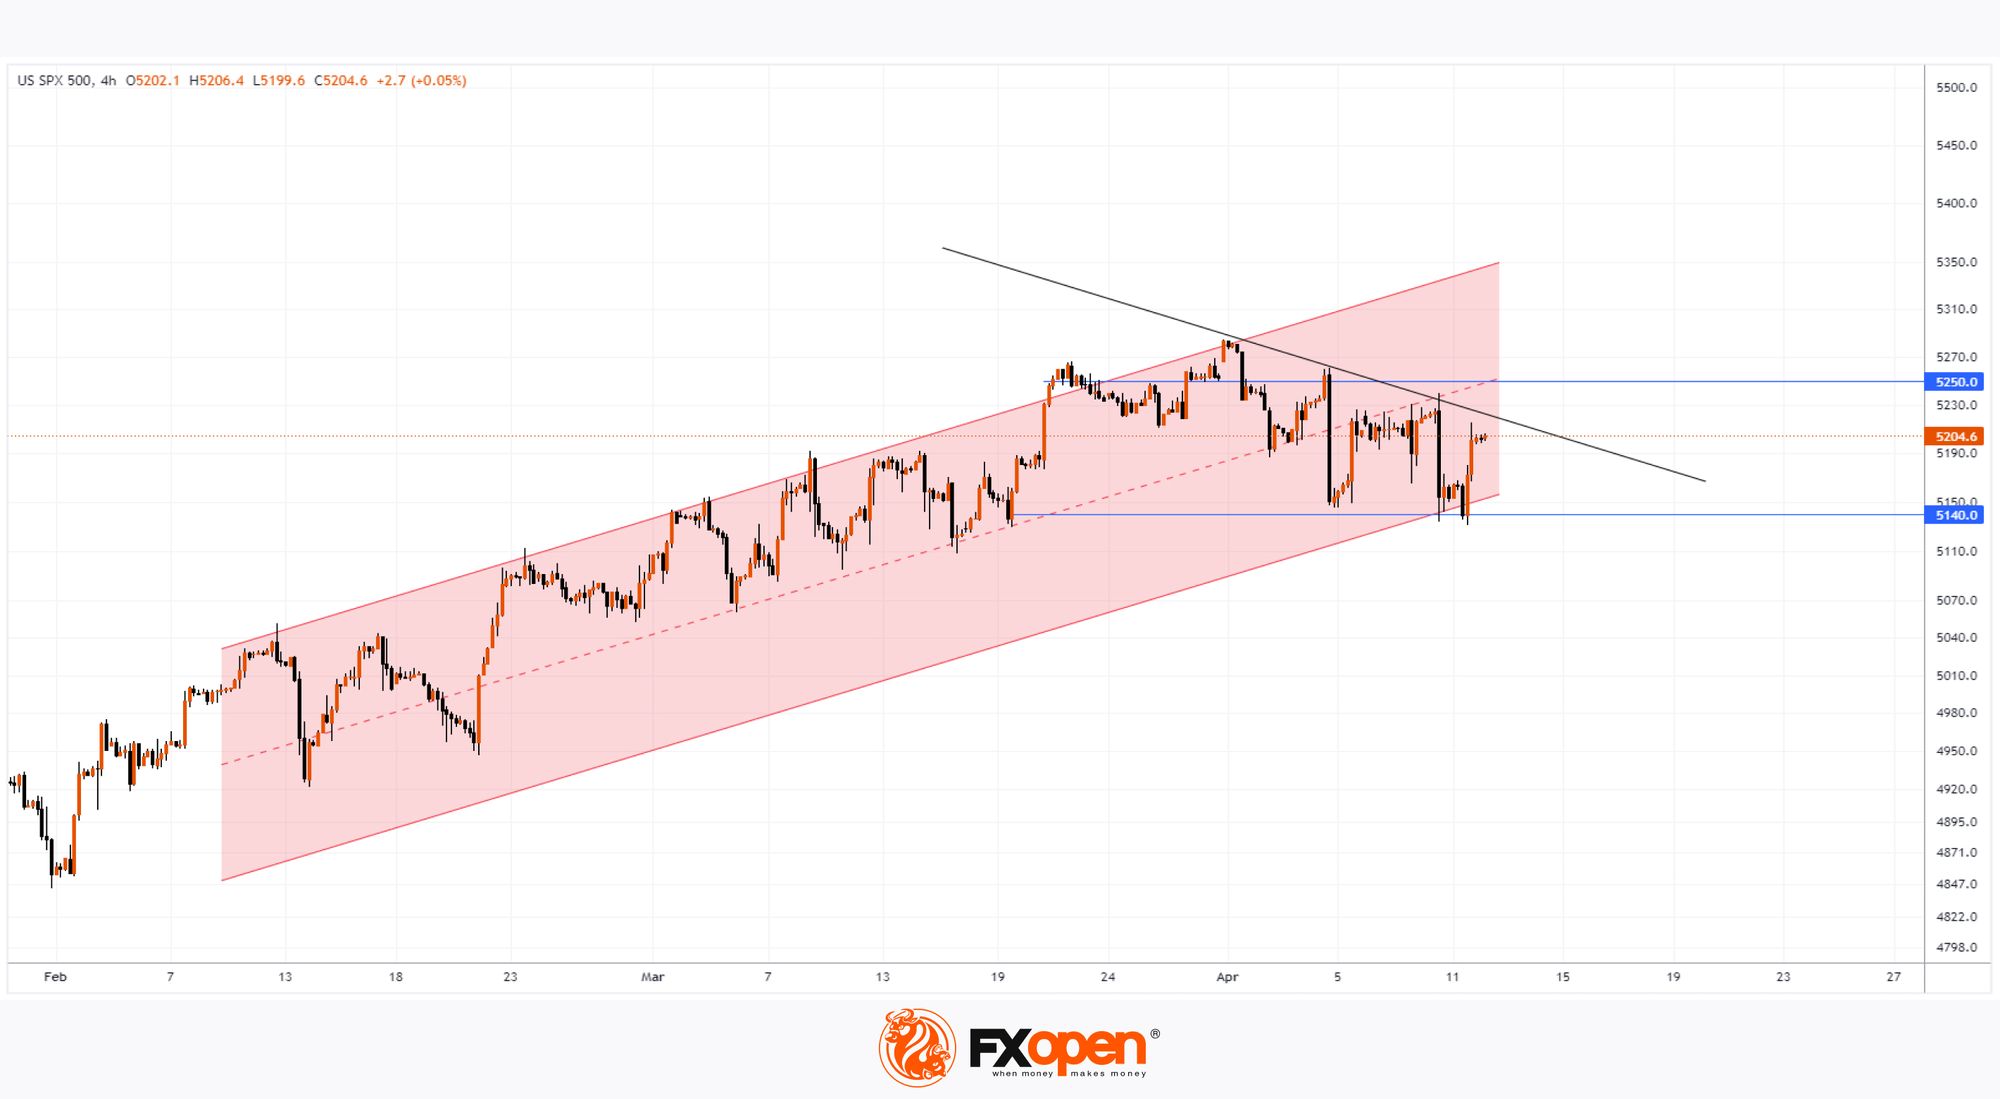
At the same time, a bottom-up reversal has formed on the S&P 500 chart, which:
→ reflects changing moods. Since the publication of the PPI has allayed some concerns about persistently high price pressures in the economy;
→ corrected the location of the lower border of the ascending channel (shown in blue), confirming its action as support.
After news-filled days related to inflation and expectations of a change in Fed monetary policy, investors' focus turns to earnings season. Today after the close of the trading session about JPMorgan Chase & Co
(JPM), Citigroup Inc (C), and Wells Fargo & Co (WFC).
According to technical analysis of the S&P-500 chart:
→ the median line of the ascending channel works as resistance, “not letting” the price into the upper half of the channel. This strengthens the mentioned resistance level of 5250.
→ if the bulls fail to build on Thursday’s momentum, the price may enter consolidation between the levels of 5140 and 5250. The closest test for the sustainability of demand is the trend line (shown in black).
Trade global index CFDs with zero commission and tight spreads. Open your FXOpen account now or learn more about trading index CFDs with FXOpen.
This article represents the opinion of the Companies operating under the FXOpen brand only. It is not to be construed as an offer, solicitation, or recommendation with respect to products and services provided by the Companies operating under the FXOpen brand, nor is it to be considered financial advice.
Latest from Indices
Latest articles

GBP/USD Bulls Struggle While USD/CAD Regains Strength
GBP/USD declined below the 1.2550 support zone. USD/CAD is rising and might aim for more gains above the 1.3760 resistance.
Important Takeaways for GBP/USD and USD/CAD Analysis Today
· The British Pound started a fresh
AUD/USD Analysis: Aussie Weakens After RBA Decision
Following its decision on 7th May, the Reserve Bank of Australia (RBA) opted to maintain the interest rate at 4.35%, despite inflation continuing to decrease at a slower pace than anticipated by the RBA.
"I think we still think
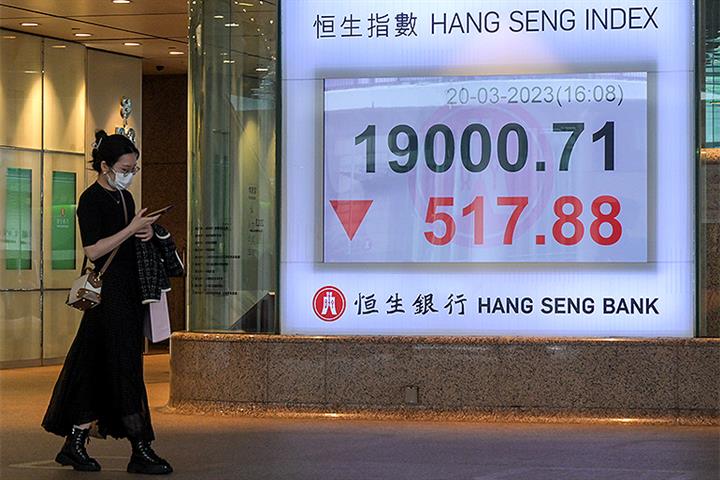
The Hang Seng Index Has Risen by Over 13% in 2 Weeks
Analyzing the Hang Seng (Hong Kong 50 at FXOpen) chart, we wrote on January 30th that the price was near an important support level formed by the lower boundary (shown in orange) of a long-term channel, which has been relevant