


ETHUSD and LTCUSD Technical Analysis – 14th OCT, 2021
FXOpen

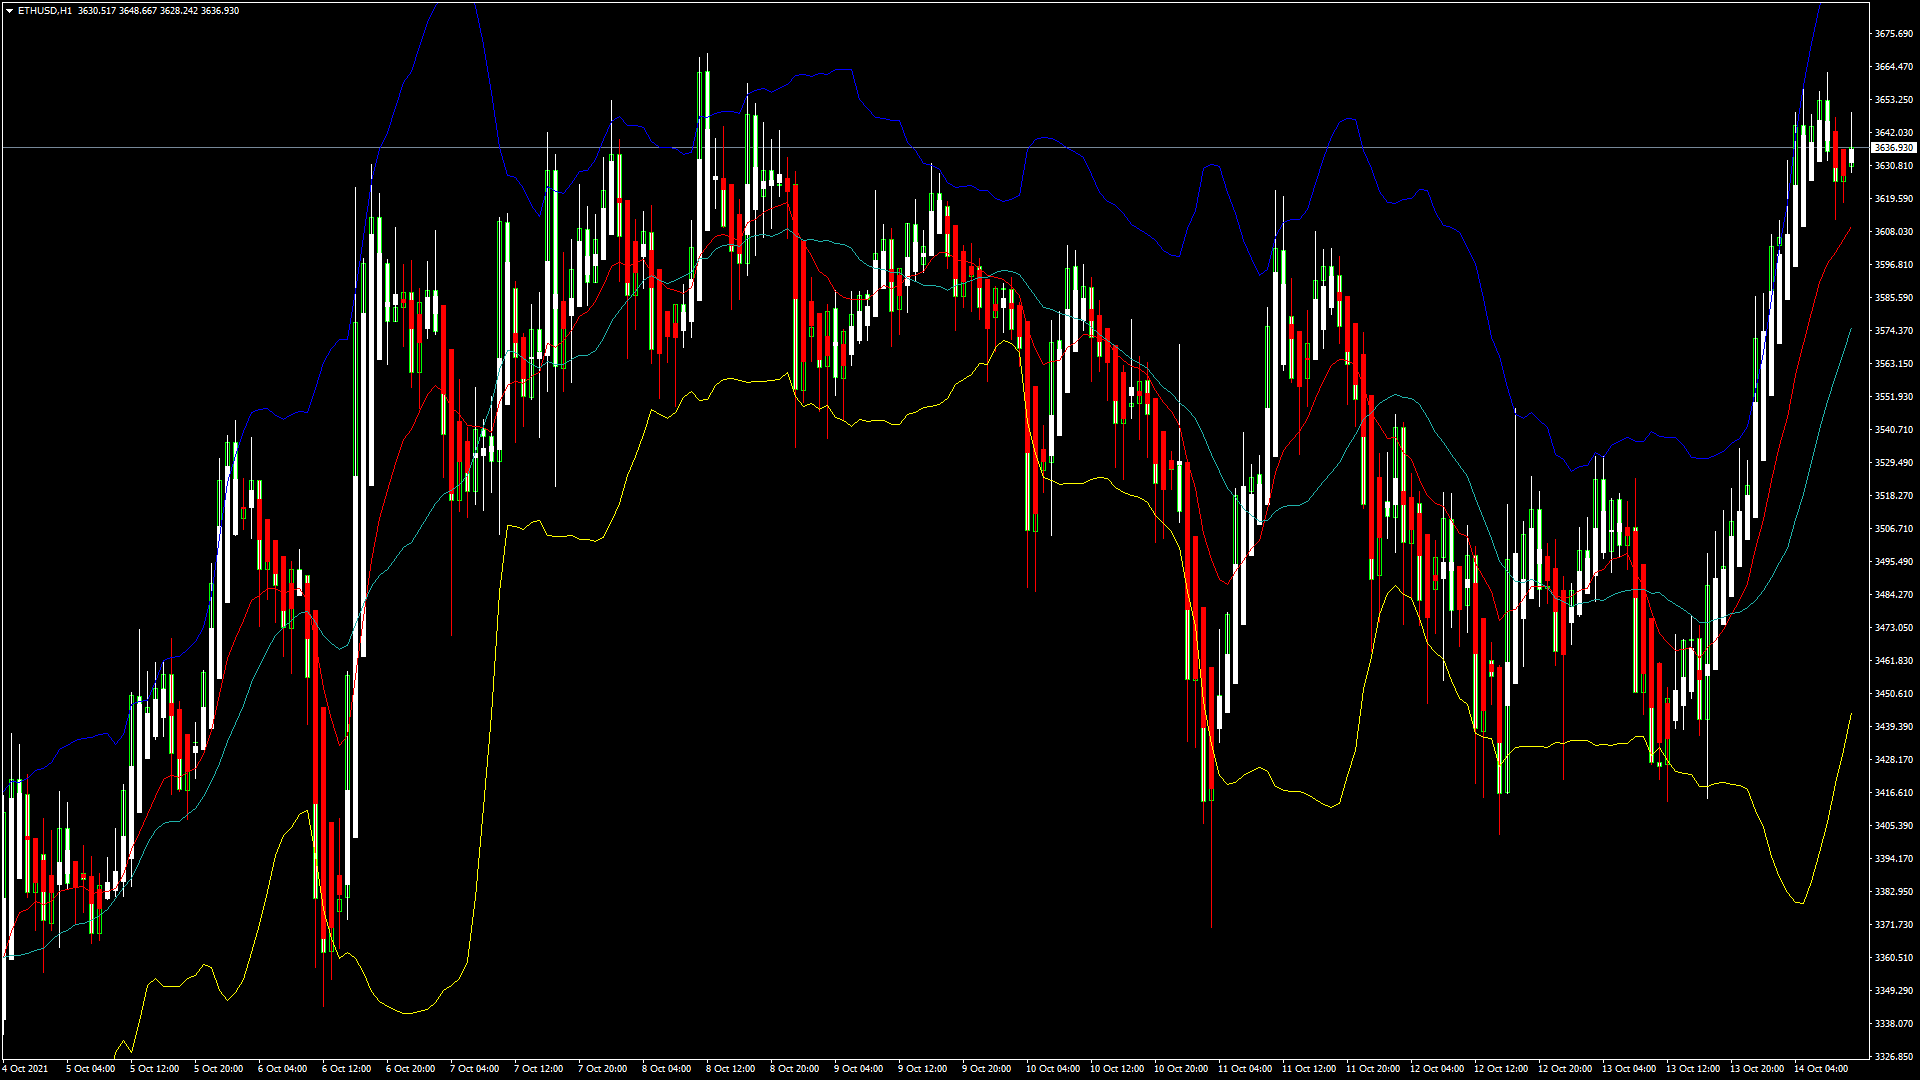
ETHUSD: Bullish Momentum Towards $4000
Ethereum has broken out of an important psychological resistance level of $3500 and is now moving in a strong bullish momentum towards the $4000 handle. ETHUSD touched an intraday high of $3662 in the European trading session today.
ETH is now trading above its pivot levels of $3628 and Camarilla resistance levels of $3633, with the price surging continuously and getting ready to break its classic resistance levels of $3654.
Ether is expected to maintain the bullish tone this week and continue towards the $4000 mark as the bulls take over. All the technical indicators are giving a BUY signal.
ETH is now moving above both the 100 hourly simple and exponential moving averages. Before touching the $4000 handle, a contraction in prices is expected this week.
- Ethereum is consolidating its gains with a firm bullish tone
- Short term to medium term outlook remains bullish for ETHUSD
- All the moving averages are giving a STRONG BUY signal
- The pair is expected to touch $3800 in the US trading session today
Ether Consolidating Its Gains
ETHUSD is forming an uptrend continuation pattern which signifies that a breakout could occur at any time, pushing the prices above the $4000 handle. At the start of the Asian trading session, volatility was low, but then the demand increased leading to the surge in the price.
ETH has gained 5.62% with a price change of +$193.78 in the past 24hrs and has a trading volume of 16.861 billion USD.
Ethereum For Investors
Ethereum is gaining more acceptance as an investment option for long-term appreciation, leading to higher demand. The upside potential for Ethereum is higher than bitcoin in terms of percentage gains, the reason why many bitcoin investors are now turning to Ethereum.
ETHUSD was priced at $586 during the same period in October 2020, and with the current market prices of $3644, a gain of 621% is observed. Some crypto analysts have cited Ethereum as a better investment alternative to gold.
The Week Ahead
Ethereum buying pressure is increasing today. The prices could reach the $4000 mark this week. There is no visible contraction in the prices of Ether today, but in the coming days, we could see some short-term bearish corrections towards the $3500 level.
Ethereum midterm range is positive and any dips will remain as an attractive buying opportunity for long term traders.
This week, ETH is expected to close above $3900 level. The trend will most likely continue in the opening of next week.
Technical Indicators:
Relative strength index (14-day): at 66.41 indicating a BUY
Commodity channel index (14-day): at 70.69 indicating a BUY
Rate of price change: at 3.581 indicating a BUY
Moving averages convergence divergence (12,26): at 38.79 indicating a BUY
LTCUSD – Bullish Engulfing Pattern Above $165
Litecoin is currently printing above the $170 handle, and its price is about to cross its pivot level of 179.60 in the European trading session. It has already crossed its 100 hourly simple and exponential moving averages. Any dips in LTCUSD remain well supported, and we can see the price reaching $185 today in the US trading session.
All the moving averages are giving a STRONG BUY signal at the current market prices of 179.15
Litecoin now needs to clear its Camarilla resistance levels of 180.09 and classic resistance levels of 181.13, after which the path from $185 to $190 will be cleared.
A bullish engulfing [pattern is seen in Litecoin at levels above $165, which signifies that short-term and medium-term outlooks for Litecoin remain bullish.
- 100 hourly and 200 hourly moving averages are both indicating a BUY
- Medium-term trend remains bullish with upside targets of $190
- Range bound trading could be seen before the prices move upwards of $180 handle
- Average true range indicates less market volatility today
Litecoin Price Gains Pace

LTCUSD touched an Intraday high of 181.05, and a short term correction in its prices is expected before the continuation of the bullish run towards the $185 handle.
This week we saw a mixed start with the prices of LTCUSD touching a high of 185.37 and a low of 166.35.
Litecoin is trading with less market volatility today; more trading volumes could still be seen later. In the last 24hrs, LTCUSD has risen by +5.80% with +9.82$ in price, and has a 24hr trading volume of USD 2.552 billion.
The Week Ahead
The pullback in Litecoin was strong. It is expected to cross its major resistance levels of $186 within this week.
Short selling in the LTCUSD could occur at $185 level, lowering the price below $175 this week.
The correlation between bitcoin and Litecoin at 0.9 and a stronger demand for BTC will continue to push the prices of LTC over $190.
Next week, it is expected to reach $185 as the immediate target and then move towards the 190-200 handle.
Technical Indicators:
Relative strength index (14-day): at 60.23 with a BUY
Rate of price change: at 2.159 with a BUY
Moving averages convergence divergence (12,26): at 1.785 with a BUY
Bull/Bear power (13-day): at 2.232 indicating a BUY
FXOpen offers the world's most popular cryptocurrency CFDs*, including Bitcoin and Ethereum. Floating spreads, 1:2 leverage — at your service (additional fees may apply). Open your trading account now or learn more about crypto CFD trading with FXOpen.
*Important: At FXOpen UK, Cryptocurrency trading via CFDs is only available to our Professional clients. They are not available for trading by Retail clients. To find out more information about how this may affect you, please get in touch with our team.
This article represents the opinion of the Companies operating under the FXOpen brand only. It is not to be construed as an offer, solicitation, or recommendation with respect to products and services provided by the Companies operating under the FXOpen brand, nor is it to be considered financial advice.
Stay ahead of the market!
Subscribe now to our mailing list and receive the latest market news and insights delivered directly to your inbox.


Latest articles

AUD/USD: Will the RBA Be Able to Keep Its Currency Strong?
As the chart shows, AUD/USD has entered a distinctly bearish phase in recent weeks, reflecting the broader consolidation — and in some cases outright weakness — that the US dollar has begun imposing across most major currency pairs.
Fundamental Analysis
The

AUD/CAD: Pair Remains Range-Bound Amid Interest Rate Divergence
The key macroeconomic factor for AUD/CAD remains the divergence in monetary policy between the two central banks. After three consecutive rate hikes since the beginning of the year, the Reserve Bank of Australia left its cash rate unchanged at

Brent Crude Oil Analysis: Stabilisation or Simply a Pause?
Over the past few weeks, financial markets have been more focused than ever on developments surrounding the Strait of Hormuz — a critical waterway at the centre of ongoing US-Iran negotiations. The back-and-forth of diplomatic headlines has injected significant volatility into