


FXOpen

On March 18, we wrote about the activation of bears near the USD 70,000 level and the likelihood of consolidation forming near this psychological mark.
On March 25, we wrote that anxiety remains in the Bitcoin market.
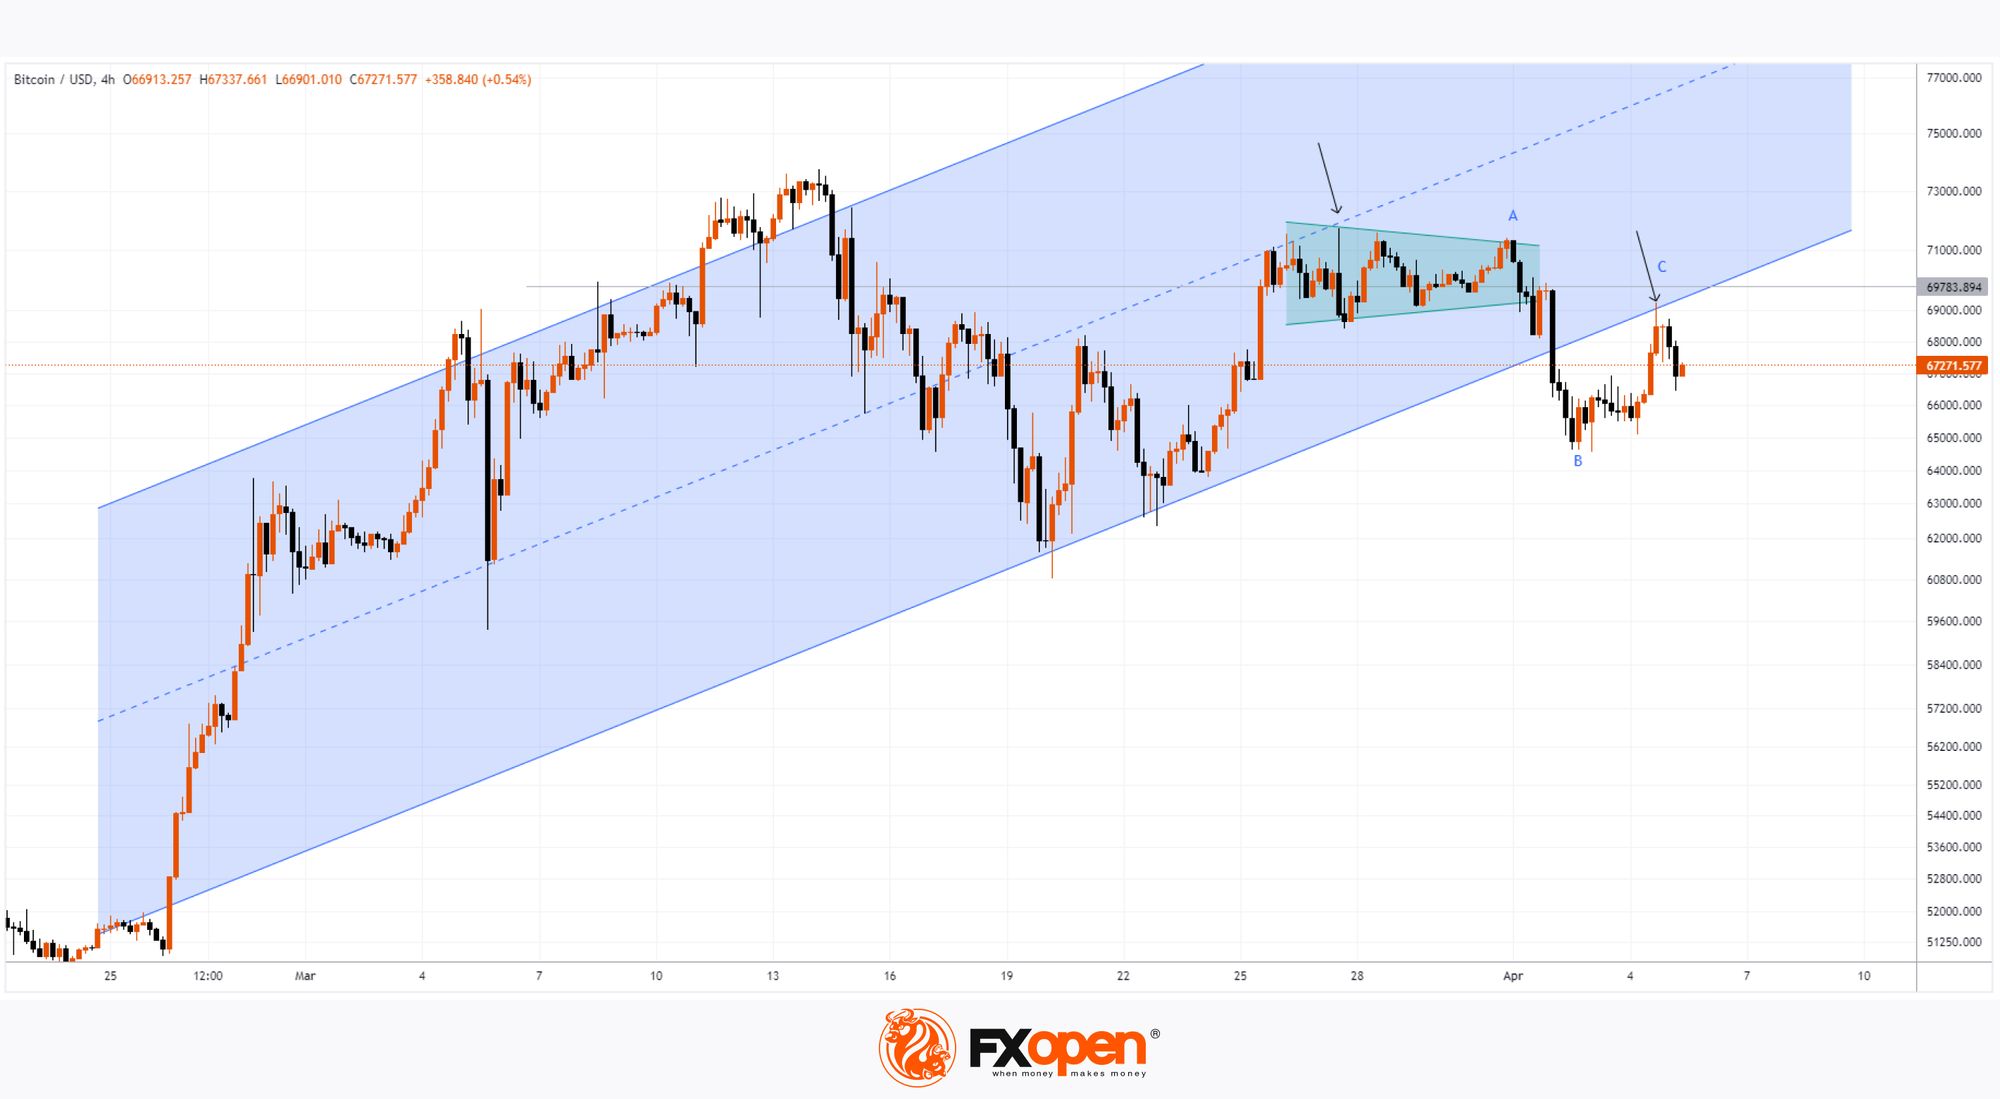
Technical analysis of the BTC/USD chart with new data on the behavior of Bitcoin prices today relative to the previously designated levels and lines shows that bearish arguments are becoming more convincing:
→ the median line of the ascending channel acted as resistance (shown by the first arrow);
→ the price has formed a consolidation zone (shown in green) with a subsequent bearish exit from it;
→ after a bearish breakdown of the lower border of the ascending channel, it showed signs of resistance (shown by the second arrow);
→ the increase in B→C is about 50% of the decrease in A→B, which corresponds to the proportion of the normal intermediate recovery within the dominant bearish trend.
Attempts to reach the level of USD 70k for Bitcoin in April were unsuccessful. The inability of the cryptocurrency price to demonstrate bullish dynamics is alarming due to the approaching halving, which is considered a positive factor influencing the price of Bitcoin.
It is possible that further developments will provide more turning points for building a downward channel.
FXOpen offers the world's most popular cryptocurrency CFDs*, including Bitcoin and Ethereum. Floating spreads, 1:2 leverage — at your service. Open your trading account now or learn more about crypto CFD trading with FXOpen.
*At FXOpen UK and FXOpen AU, Cryptocurrency CFDs are only available for trading by those clients categorised as Professional clients under FCA Rules and Professional clients under ASIC Rules respectively. They are not available for trading by Retail clients.
This article represents the opinion of the Companies operating under the FXOpen brand only. It is not to be construed as an offer, solicitation, or recommendation with respect to products and services provided by the Companies operating under the FXOpen brand, nor is it to be considered financial advice.
Latest articles

How to Identify and Trade Liquidity Grabs
Understanding the intricacies of market liquidity and the role of liquidity grabs can be crucial for optimising trading strategies. Liquidity grabs, creating rapid price movements, are a key component of Smart Money trading. This article explores how to identify these

What Is a Piercing Line Pattern, and How Can You Trade with It?
In the world of technical analysis, the piercing line pattern stands out as a solid indicator of potential market reversals. This article delves into the nuances of this two-candlestick pattern, exploring its formation, significance, and how traders can effectively leverage
London Calling! FTSE 100 Stocks Flying High Once Again
Back in 2021, which when looking at a physical calendar does not seem such a long time ago yet feels like an epoch ago when considering the changes in global economies and the capital markets since then, the FTSE 100