


FXOpen
BTC/USD
Last week on Monday, November 20th the price of Bitcoin was at $4977, the week’s highest point. From that high, the price went back to the levels from which the increase around $4500 was made and then continued to move to the downside. Measured to the current level of $3748 the price of Bitcoin has fallen by 24.65%.
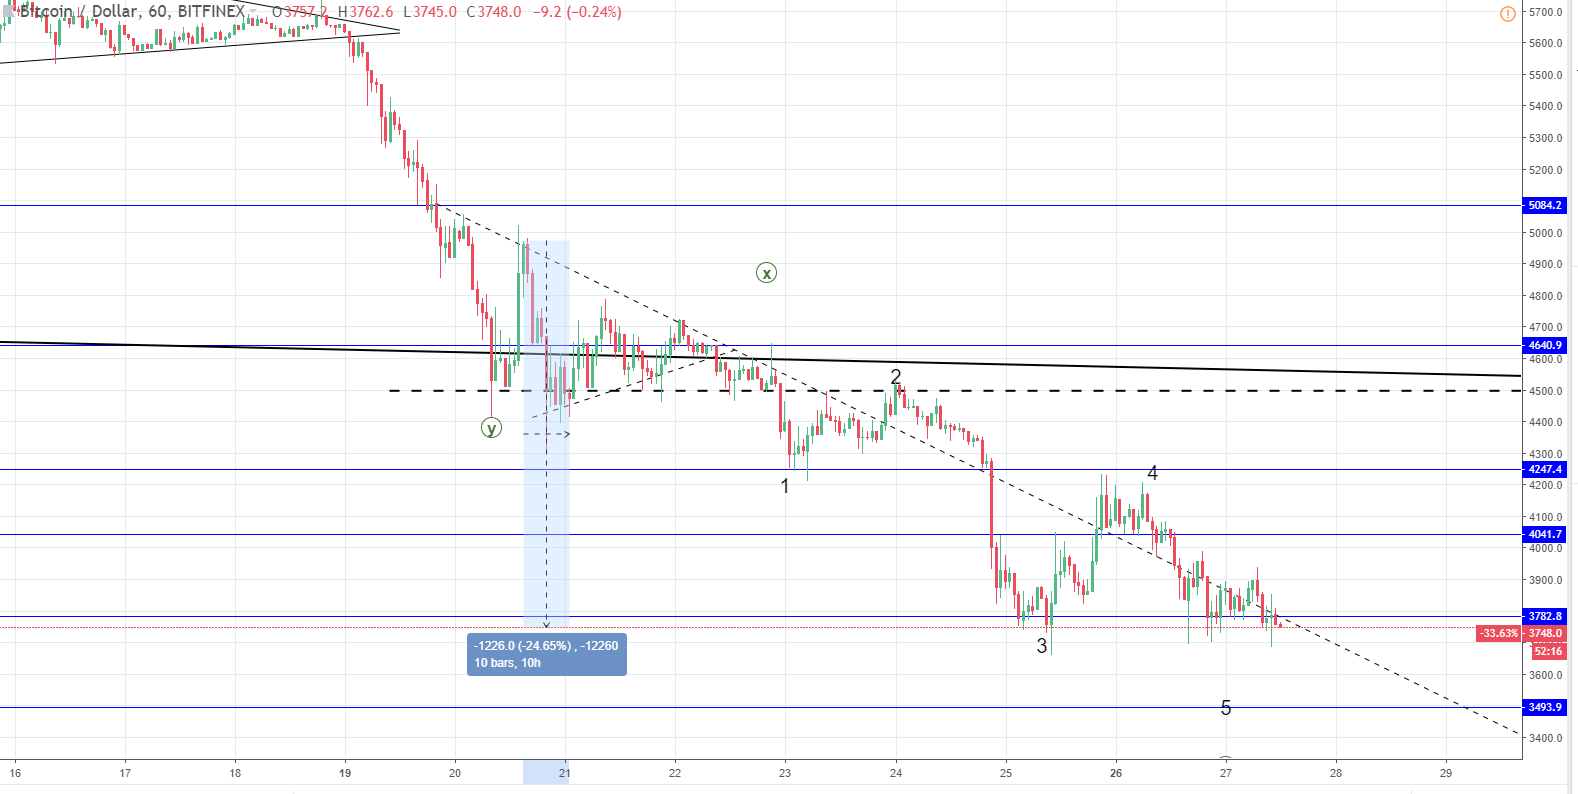
Looking at the hourly chart, you can see that the price action is indicating a downtrend even though it looks like the price has stabilized at around $3782, where the horizontal significant level is serving as support. Since the price interacted with the level for the third time in the last couple of days, currently we are seeing that the price is below the mentioned level.
This indicates sellers pressure on to the price support level. Hence, we might see another breakout to the downside where the next horizontal support level at $3494 would be a target for the support zone as well as the completion of the down move. Last week the price broke out from the symmetrical triangle or a bearish pennant. It resulted in a breakout from the downside. Since then the price action structure has looked like the 5 waves impulsive move is almost up.
The 5th wave could have ended on the mentioned horizontal support level on today’s interaction. It could also very likely be that the 5th wave ends on the next horizontal level at around $3500. But in either case, I would be expecting a quick recovery as the down move clearly has a bit more room before its end.
Zooming out to the 4-hour chart, you can see that the 5 waves are the sub-waves from the last corrective Z wave, counted from the previous breakout at around $6500.
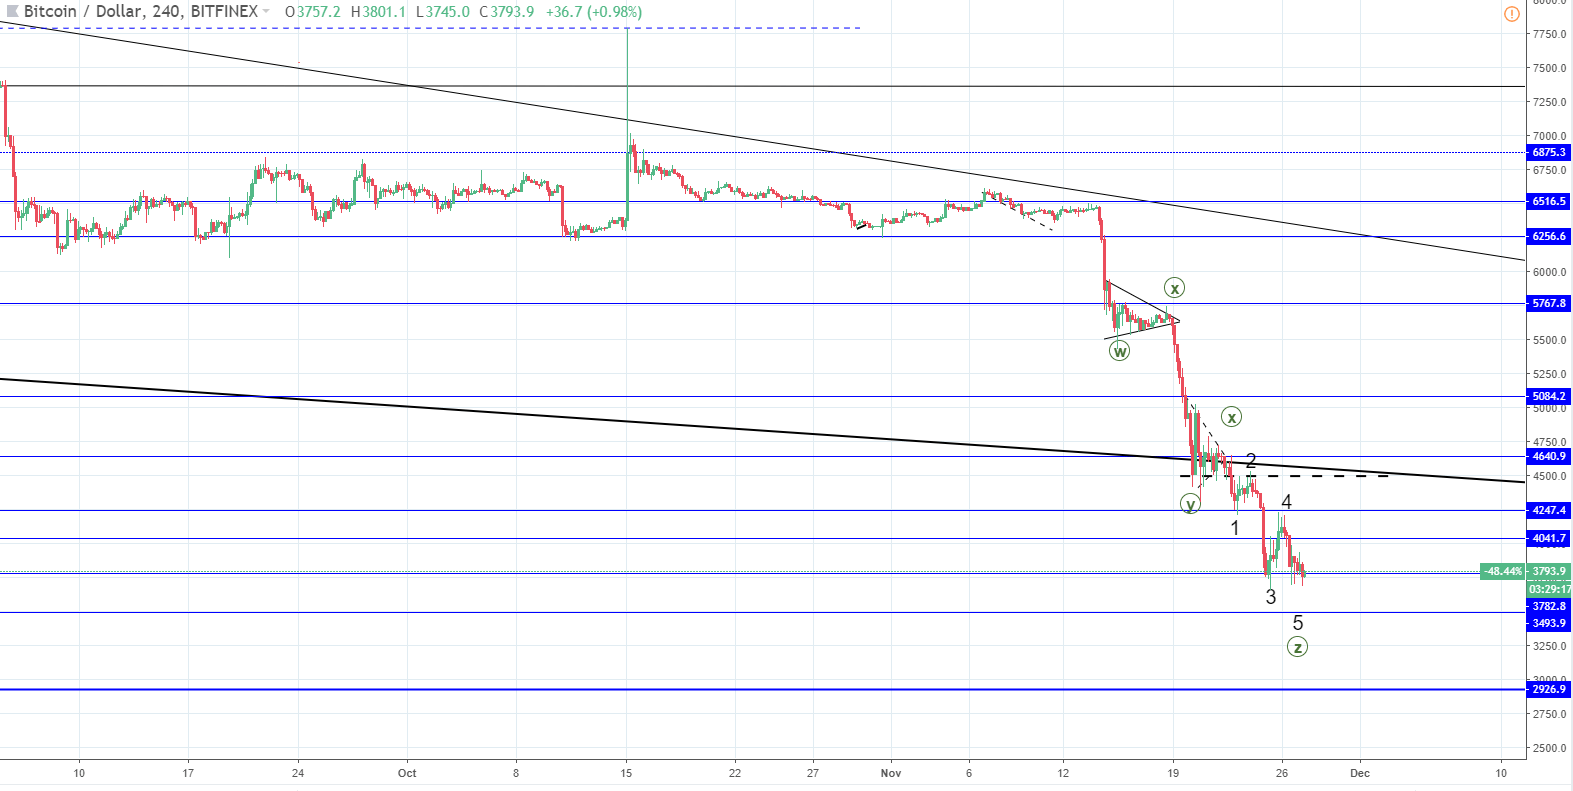
Since the price has fallen by around 42% measured from $6493 to the current levels, the price can’t go much further down without having to recover first and retest the prior support for the resistance. Soon I would be expecting that the price starts increasing and the fist most significant resistance line I would be looking at for a rejection is at $4509. This is the area from the breakout off of the descending channel baseline support (bold black line) and the minor horizontal significant level.
XRP/USD
From last weeks high at $0.4811 the price of Ripple has fallen by 26.59% measured to the current levels of $0.3525.
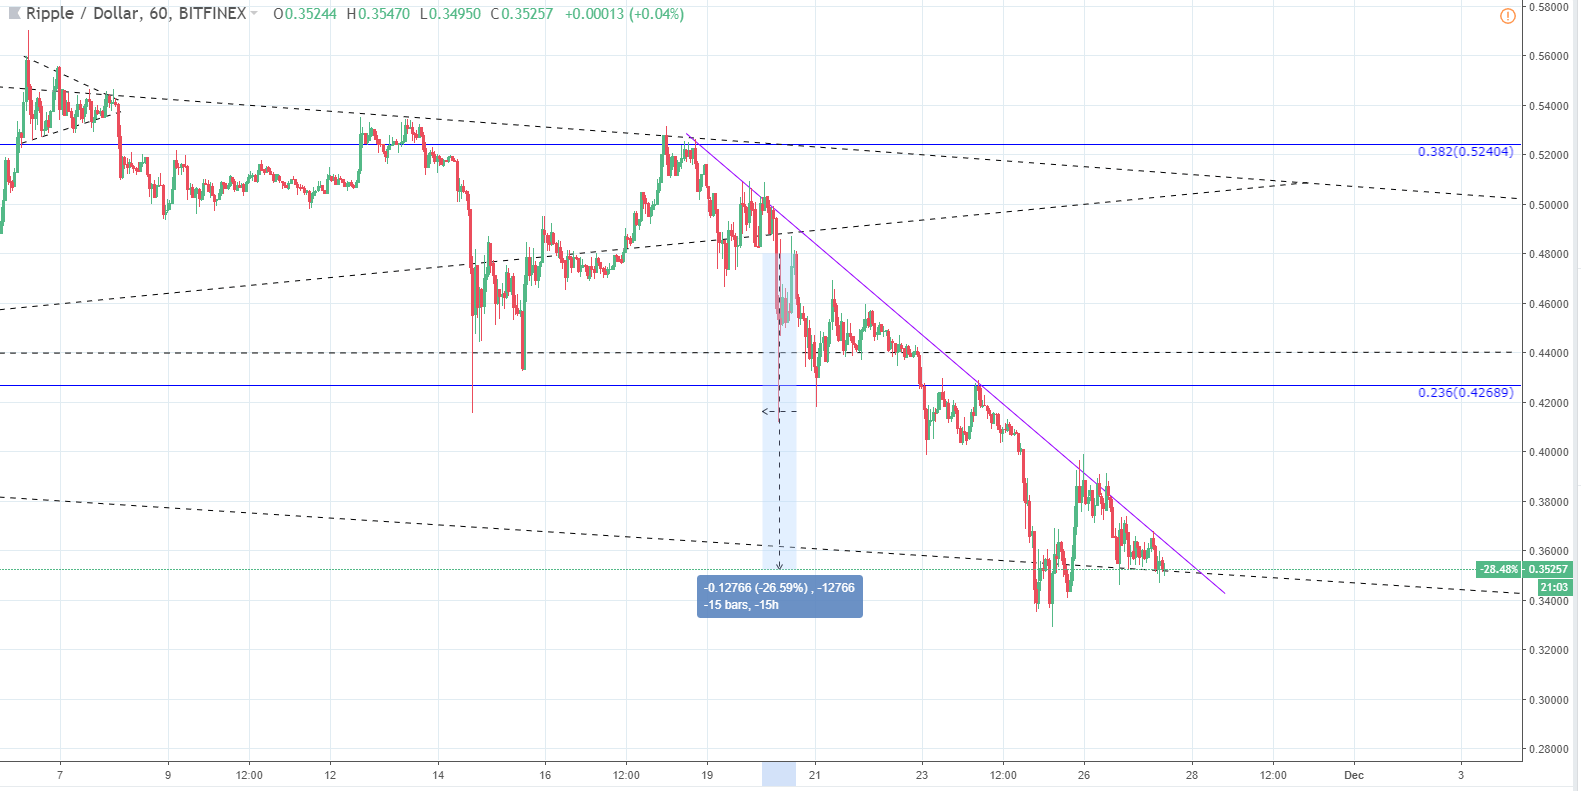
As you can see from the hourly chart, the price has been trending down since November 18th. Since the downtrend line hasn’t been broken (purple line) and the price is on the support level from the descending channel clearly seen on a higher time-frame, we are going to see which pattern proves to be more dominant.
Zooming out to the 4-hour time frame, you can see the mentioned descending channel more clearly as well as my Elliott Wave projection.
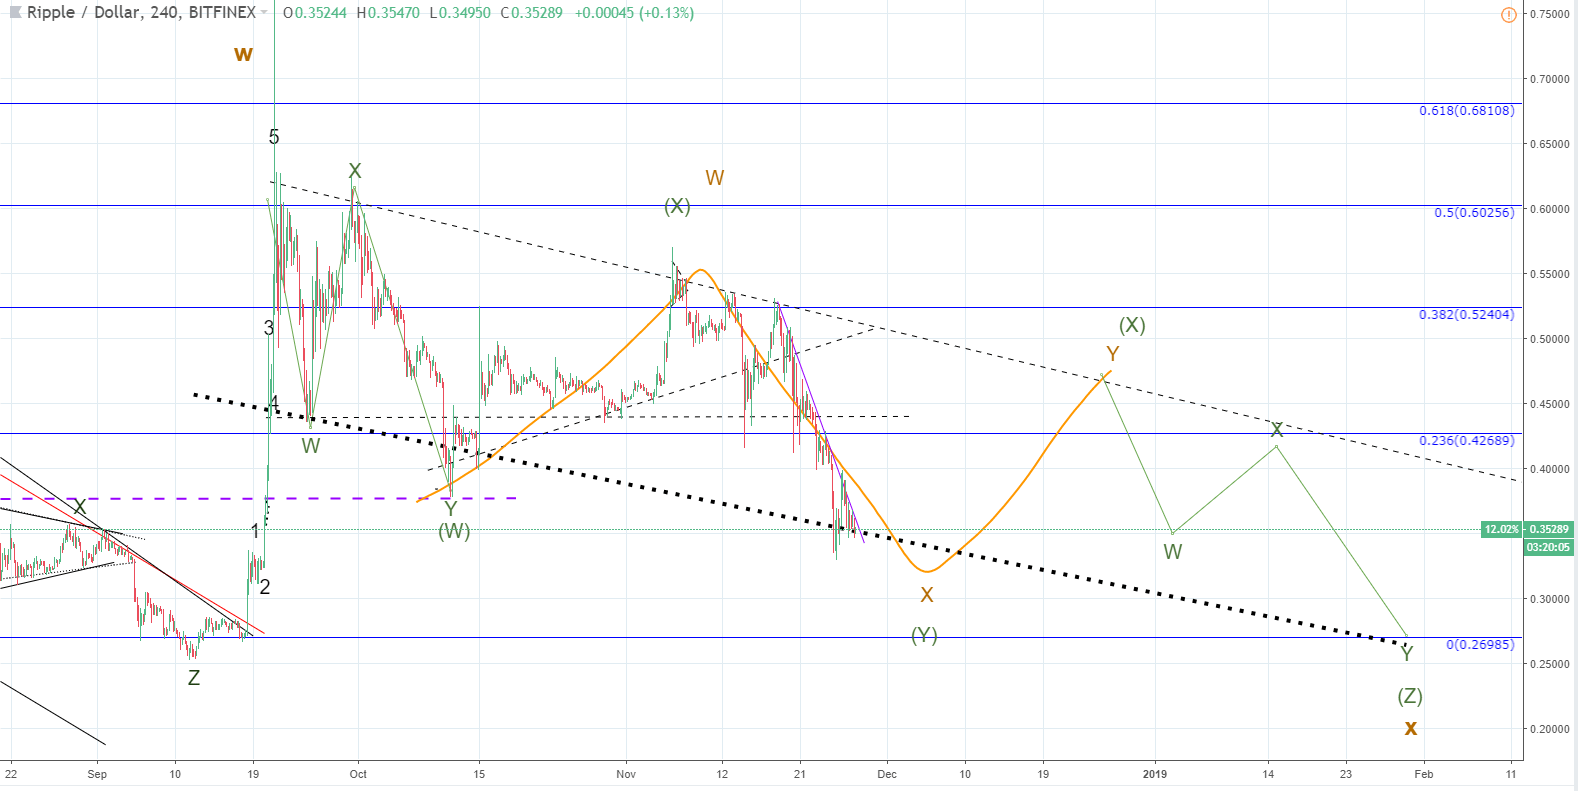
The current down move has been labeled as the second X wave from the second Minor WXY correction or the wave Y from the Intermediate count. I would be expecting that the price recovers from here or moves to another low and recovers from there, similarly like in the case of Bitcoin.
The horizontal level I would be looking for when the price starts increasing is at the 0.236 Fibonacci retracement level. The crossing of the Fibonacci level would mean that the price can potentially go higher than it was projected for the recovery wave Y. It will depend on were the price currently finds support – the lower the support the lower the recovery.
FXOpen offers the world's most popular cryptocurrency CFDs*, including Bitcoin and Ethereum. Floating spreads, 1:2 leverage — at your service. Open your trading account now or learn more about crypto CFD trading with FXOpen.
*At FXOpen UK and FXOpen AU, Cryptocurrency CFDs are only available for trading by those clients categorised as Professional clients under FCA Rules and Professional clients under ASIC Rules respectively. They are not available for trading by Retail clients.
This article represents the opinion of the Companies operating under the FXOpen brand only. It is not to be construed as an offer, solicitation, or recommendation with respect to products and services provided by the Companies operating under the FXOpen brand, nor is it to be considered financial advice.
Latest articles

Anchored VWAP and How You Can Use It in Forex Trading
In the world of forex trading, understanding the nuanced tools at your disposal can significantly enhance decision-making processes. One such sophisticated tool is the Anchored Volume-Weighted Average Price (Anchored VWAP), which refines the standard VWAP by allowing traders to set

META Share Price Collapses after Publication of Quarterly Report
Just yesterday, META's stock price closed at USD 493.50, up approximately 40% since the start of 2024 and up nearly 300% since the start of 2023.
However, following the release of Meta's quarterly report, its shares plummeted to USD

USD/JPY Analysis: The Rate Exceeds The Level of 155 Yen Per US Dollar
Today, the price of USD/JPY once again renewed its 34-year high, exceeding the level of 155 yen per dollar, which put pressure on the current authorities.
According to Reuters, officials are trying to maintain calm in the market.
"We