


FXOpen
Bitcoin had a substantial correction last week leading to the end of the latest month-long bull run. Litecoin followed big brother lower but has not ended the uptrend yet.
Bitcoin Rally Ends
The uptrend started in November is finally over for BTC after prices broke below the important $12,711 swing low last Friday. Subsequently, we saw a low of $10,680 on FXOpen. From here we retraced most of the losses with prices topping out at $16,470 yesterday. We are currently quoted at $15,427 dollars per coin.
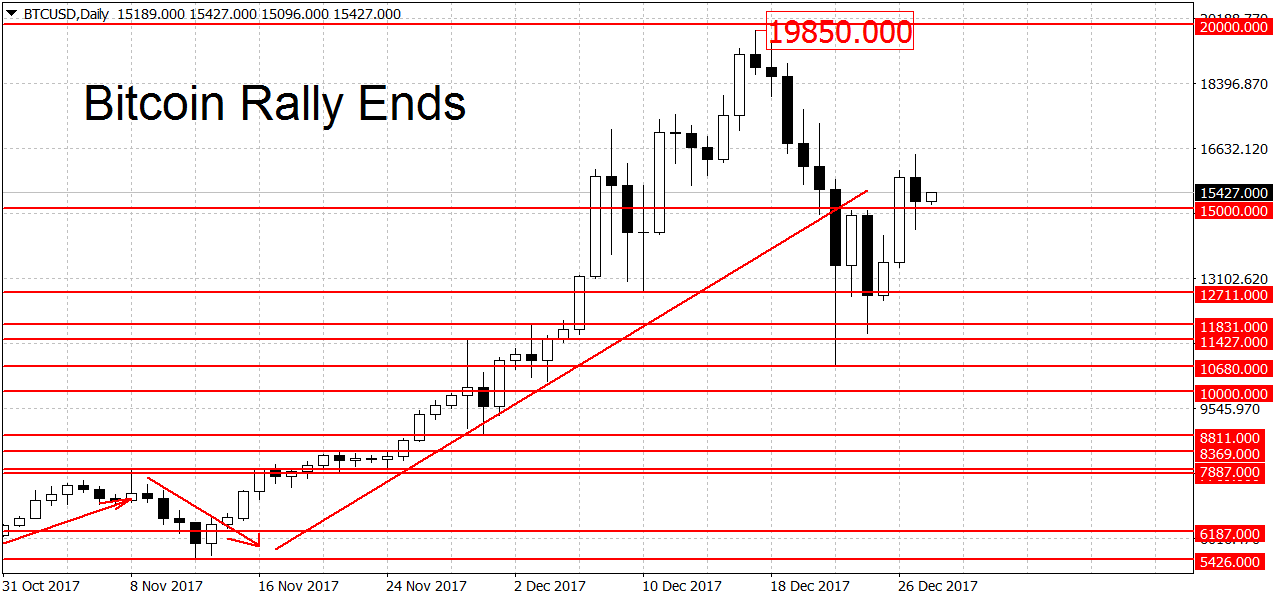
As you can see on the chart above, we are now in a range. A new rally requires a breakout above the $20,000 round figure. A new downtrend may commence if prices fall below the latest swing low at $10,680 dollars. For now, we remain in ‘wait and see’ mode. Here are some of the important support and resistance levels for bitcoin.
On the upside, we have the latest swing high at $16,470 dollars, followed by two weaker levels at the former swing highs of $17,147 and $17,547 dollars. Higher still we have a major resistance area comprised of the all-time high at $19,850 and the $20,000 round figure. A decisive breakout above this important milestone should lead to a new bullish trend on the dailies for BTC/USD. On the longer-term weekly and monthly charts, bitcoin remains in an uptrend.
Litecoin Trades Lower
During the large BTC correction last week litecoin followed bitcoin lower and hit a low of $162.22 dollars per coin last Friday. Then we saw a recovery to $291 dollars, followed by a secondary drop to $222 dollars. Since then we’ve been somewhat stuck in a trading wedge with no major market movements.
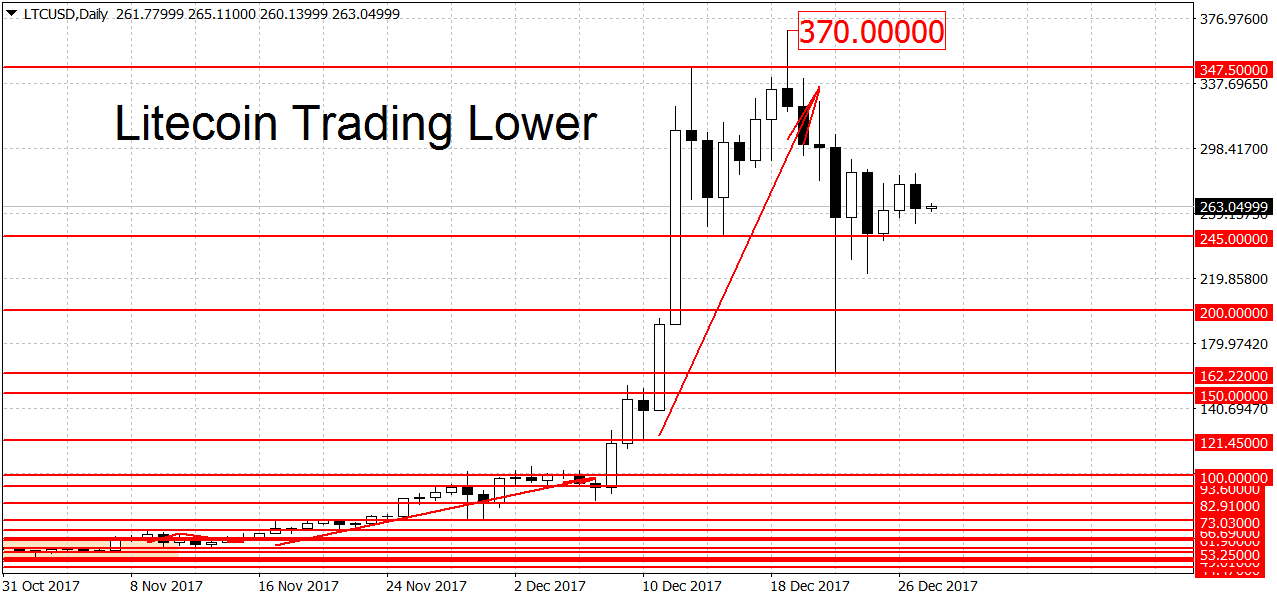
The sharp drop from the highs at $370 to $162 dollars (total $208 dollars or 56%) didn’t end the rally. The threshold to do that is now set at $162 and a break below this swing low should end the uptrend on the daily charts. On the weekly and monthly charts, LTC/USD remains in bullish mode.
Resistance above current prices can be found at the $291 swing high followed by the $300 round figure and the all-time high at $370 dollars. On the lower end, we have support at $245, $222 and $200 dollars per coin. Further down we have an important level at $162 dollars. Like we said above a break below here could end the current rally. A breakdown below the $88 swing low would start a new downtrend in prices.
Open a Crypto account and join bitcoin mt4 broker FXOpen.
FXOpen offers the world's most popular cryptocurrency CFDs*, including Bitcoin and Ethereum. Floating spreads, 1:2 leverage — at your service. Open your trading account now or learn more about crypto CFD trading with FXOpen.
*At FXOpen UK and FXOpen AU, Cryptocurrency CFDs are only available for trading by those clients categorised as Professional clients under FCA Rules and Professional clients under ASIC Rules respectively. They are not available for trading by Retail clients.
This article represents the opinion of the Companies operating under the FXOpen brand only. It is not to be construed as an offer, solicitation, or recommendation with respect to products and services provided by the Companies operating under the FXOpen brand, nor is it to be considered financial advice.
Latest articles

Anchored VWAP and How You Can Use It in Forex Trading
In the world of forex trading, understanding the nuanced tools at your disposal can significantly enhance decision-making processes. One such sophisticated tool is the Anchored Volume-Weighted Average Price (Anchored VWAP), which refines the standard VWAP by allowing traders to set

META Share Price Collapses after Publication of Quarterly Report
Just yesterday, META's stock price closed at USD 493.50, up approximately 40% since the start of 2024 and up nearly 300% since the start of 2023.
However, following the release of Meta's quarterly report, its shares plummeted to USD

USD/JPY Analysis: The Rate Exceeds The Level of 155 Yen Per US Dollar
Today, the price of USD/JPY once again renewed its 34-year high, exceeding the level of 155 yen per dollar, which put pressure on the current authorities.
According to Reuters, officials are trying to maintain calm in the market.
"We