


FXOpen
Are you looking for a way to take advantage of short-term market movements without the stress of day trading? Look no further than swing trading. In this article, we’ll dive deep into the world of swing trading, exploring how it differs from day trading, discussing its advantages and disadvantages, and taking a look at some of the most popular swing trading tools and indicators.
The Basics of Swing Trading
Swing trading involves holding a position for a short to medium period of time - usually a couple of days to a few weeks - with the aim of profiting from the “swings” in the market. A swing trader’s definition is simple: swing traders are those who typically enter and exit at significant support and resistance levels, hoping to capture the bulk of an expected move and take profits at potential reversal points in the market.
The swings are marked with numbers in the chart below.
These traders tend to look at hourly to weekly charts to guide their entries, although the specific timeframe used will depend on the swing trader’s individual style and the asset being traded. It can be used across all asset classes, from stocks and forex to crypto* and commodities. Swing plays in the stock market can be especially effective, as stocks tend to experience plenty of volatility and are subject to frequent news and events that can drive prices to traders’ targets.
Swing traders predominantly use technical analysis to determine their entries and exits, but fundamental analysis can also play a significant role compared to shorter-term styles, like day trading. Fundamental analysis, like comparing the interest rates of two economies, can help to set a swing trader’s directional bias over the course of days or weeks.
Swing Trading vs Day Trading
On the face of it, swing trading and day trading may look similar. After all, both types of traders may look to profit from one key support/resistance level to another. However, there are significant differences between them.
The most distinct difference is the holding period. Day traders aim to close all of their positions by the end of the day and tend to exit a trade within a few hours. It’s rare for swing traders to hold a position for less than a day, although it can happen if their target is met during extreme market volatility. Long-term swing trading can involve holding a position for months - something you won’t see any day trader doing.
This difference in holding period has important implications for risk management. Day trading can be riskier than swing trading, as day traders are exposed to more volatility and are more susceptible to sudden price movements. Swing traders, on the other hand, have more time to react to changes in the market and ignore intraday noise in favour of focusing on their longer-term target.
However, because day traders don’t hold their positions overnight, they also avoid the risk of any adverse events affecting their position while they’re asleep. Swing traders don’t have this luxury.
The frequent in-out nature of day trading means active traders can incur more commission fees than swing traders. Spreads are also less of a concern when swing trading, as wide intraday spreads impact a swing trader’s position less than they impact the position of a day trader.
Finally, the psychological and time pressures are reduced when swing trading. Day trading can be a highly stressful activity, and it requires near-constant attention to the charts. Swing trading can be a much more relaxed approach, avoiding the stresses of intraday price movements and allowing for much less active management.
Swing Trading Advantages and Disadvantages
Swing trading has several advantages that make it a popular choice for many traders. That said, it comes with a few disadvantages traders should be aware of. Let’s consider them.
Advantages
Lower Time Commitment
One of the biggest benefits for swing traders is the reduced time commitment. Many of us have other things going on that mean we can’t commit several hours a day to trading. Swing trading can be adapted to suit a trader’s individual schedule and may only require a few hours each week to be successful.
Flexibility
Swing trading is often more flexible than other styles of trading. Not only does it offer time flexibility, but it allows for a wider range of instruments to be traded. For example, you might have trouble performing technical analysis on the 1-minute chart for an illiquid stock, while the 1-hour chart has plenty of price action for you to analyse. In the stock market, swing trading may even be preferred because of the greater number of opportunities it can present.
Potential Higher Returns Than Long-Term Trading
Because swing traders usually hold positions for a few days to a few weeks, they have the ability to take advantage of shorter-term market movements that might not be reflected in longer-term price trends. For instance, if a stock experiences a temporary dip in price due to a short-term event, swing traders can take advantage of this dip and make a quick profit when the stock rebounds.
Disadvantages
Less Time to React to Market Changes
What is a swing trader’s biggest disadvantage? The amount of time they have to react to sudden price movements. Short-term traders that are actively managing their positions may be able to stay out of a position entirely until volatility subsides. In contrast, swing traders may not be available to adjust their position if they’re at work or asleep, leading to potentially significant losses.
Overnight Holding Risks
Part of the issue with holding trades overnight is that they can gap up or down - opening much higher or lower than the previous day’s closing price, which could mean a stop loss isn’t triggered. This can result in large losses beyond what the trader was initially willing to risk.
Requires Discipline to Hold Trades
Holding a position for several days or weeks can be tough for some traders. Intraday market movements may lead to impulsive decision-making, like closing a trade prematurely or taking a loss because of a perceived change in market direction. To weather these short-term price movements, swing traders must have the discipline to manage their emotions and only check the charts infrequently.
Popular Tools to Use When Swing Trading
A swing trader’s strategy will ultimately depend on their unique system for entering and exiting trades. There’s no right or wrong way to swing trade; the most important aspect is finding an edge over the market and achieving long-term profitability. Here are three common tools and indicators that can be used as part of a swing trading strategy.
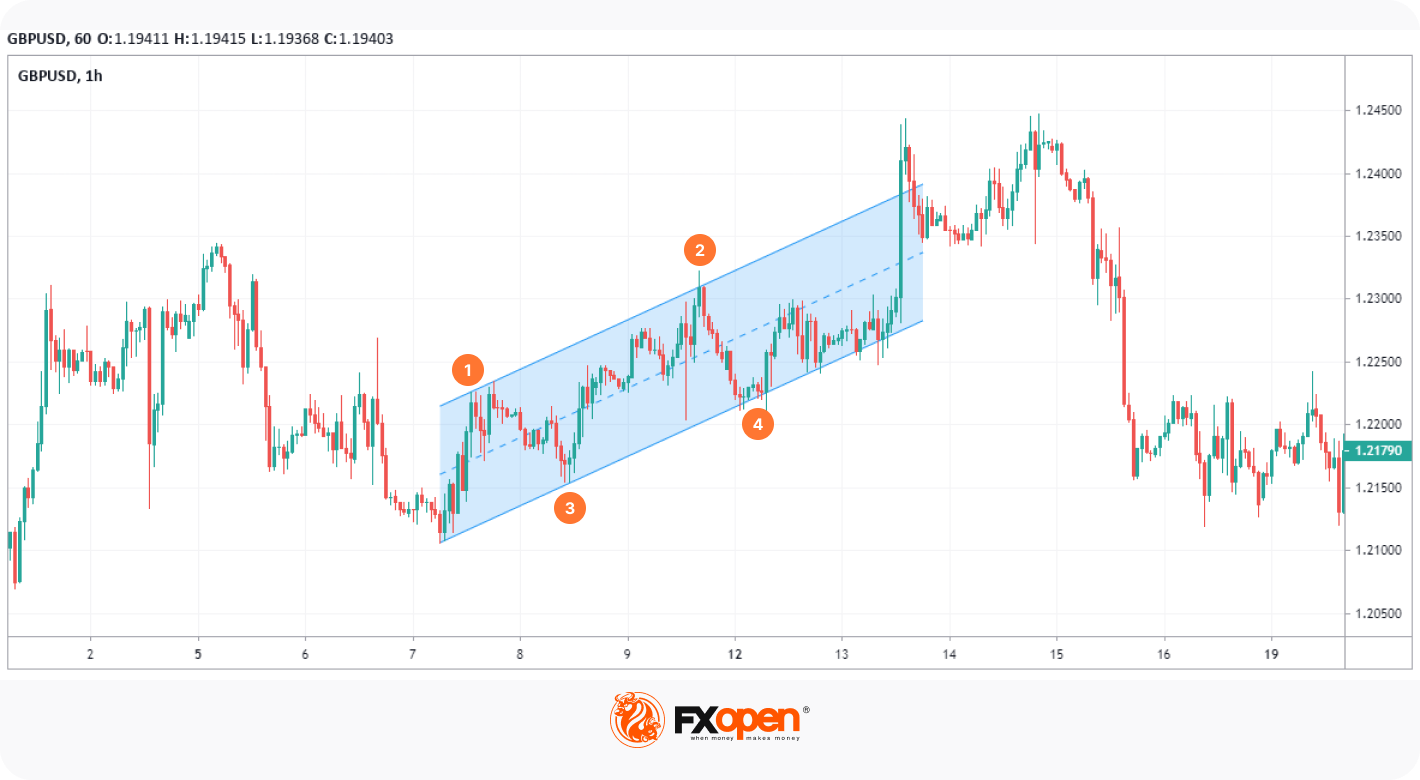
Channels
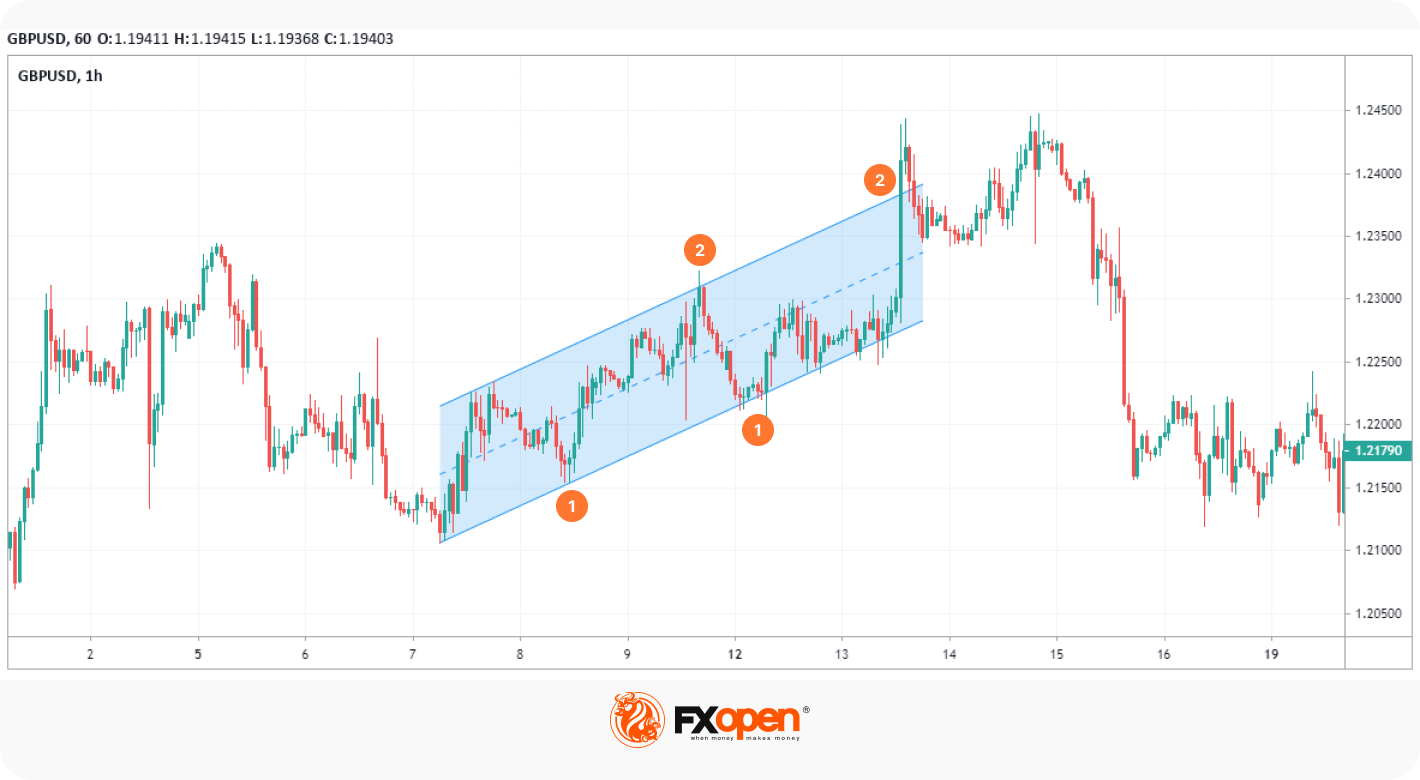
Traders can use channels to take advantage of long-term price trends that play out over days and weeks. To plot a channel, you first need to identify a trending asset that’s moving in a relative zig-zag pattern rather than one with large jumps in price. Swing traders will often use the channel to trade in the direction of the trend; in the example above, they might look to buy when the price tests the lower line (1) and take profit when the price touches the upper line (2) of the channel.
Moving Averages
Moving averages are one of the simplest indicators, but they can help swing traders determine the direction of the trend at-a-glance. The options here are endless:
- You could pair fast and slow moving averages (MAs) and wait for the two to cross; this is known as a moving average crossover. When a shorter MA crosses above a longer one, the price is expected to rise. Conversely, when a shorter MA breaks below a longer one, the price is supposed to decline.
- You could stick with one and observe whether the price is above or below its average to gauge the trend. When the price is above the MA, it’s an uptrend; when it’s below the MA, it’s a downtrend.
- You could use an MA as a support or resistance level, placing a buy order when the price falls to the MA in an uptrend and a sell order when it rises to the MA in a downtrend.
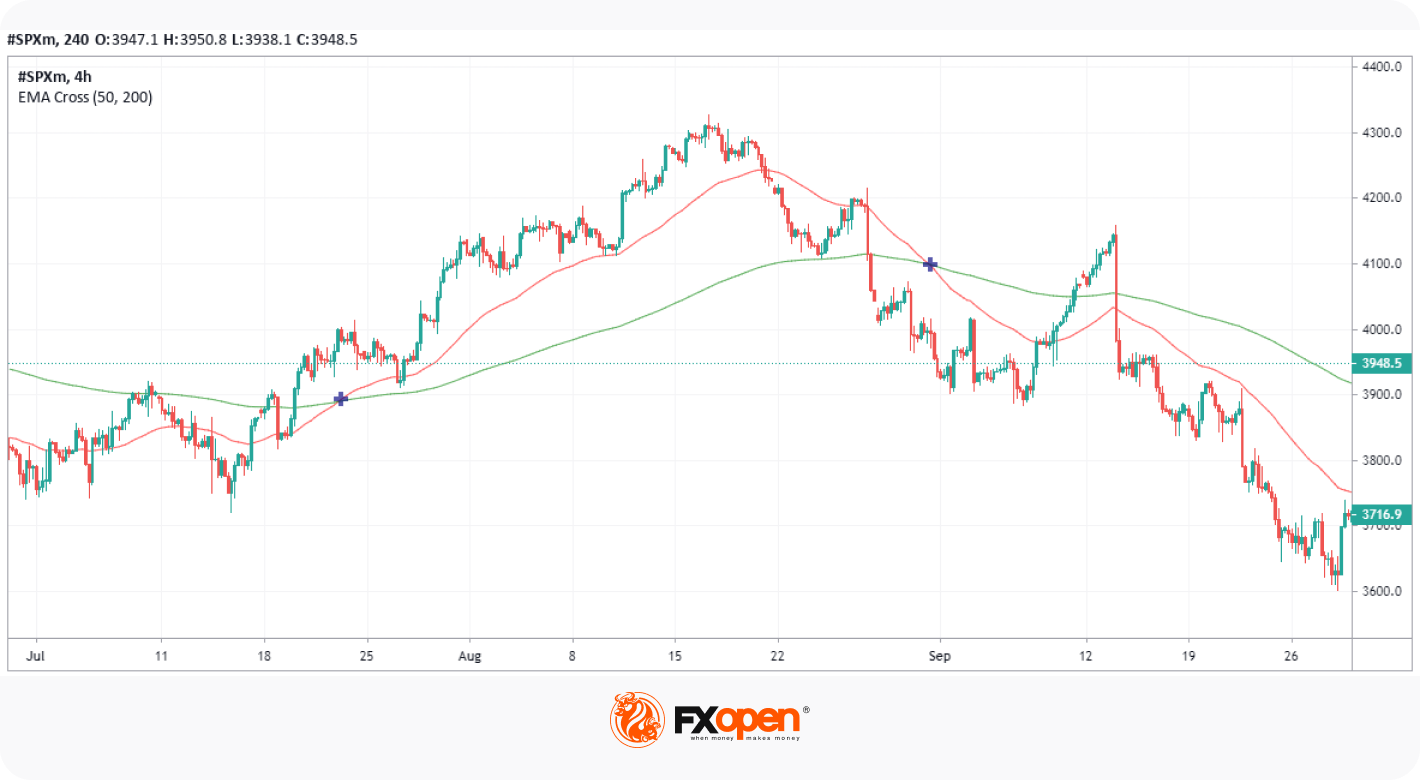
In this equity swing trading example, we’ve applied the Exponential Moving Average (EMA) Cross indicator with a 50 and 200-period length in TickTrader. As you can see, it was valuable for identifying the direction of the S&P 500 over the course of several weeks and could have resulted in a profitable swing call.
Fibonacci Retracements
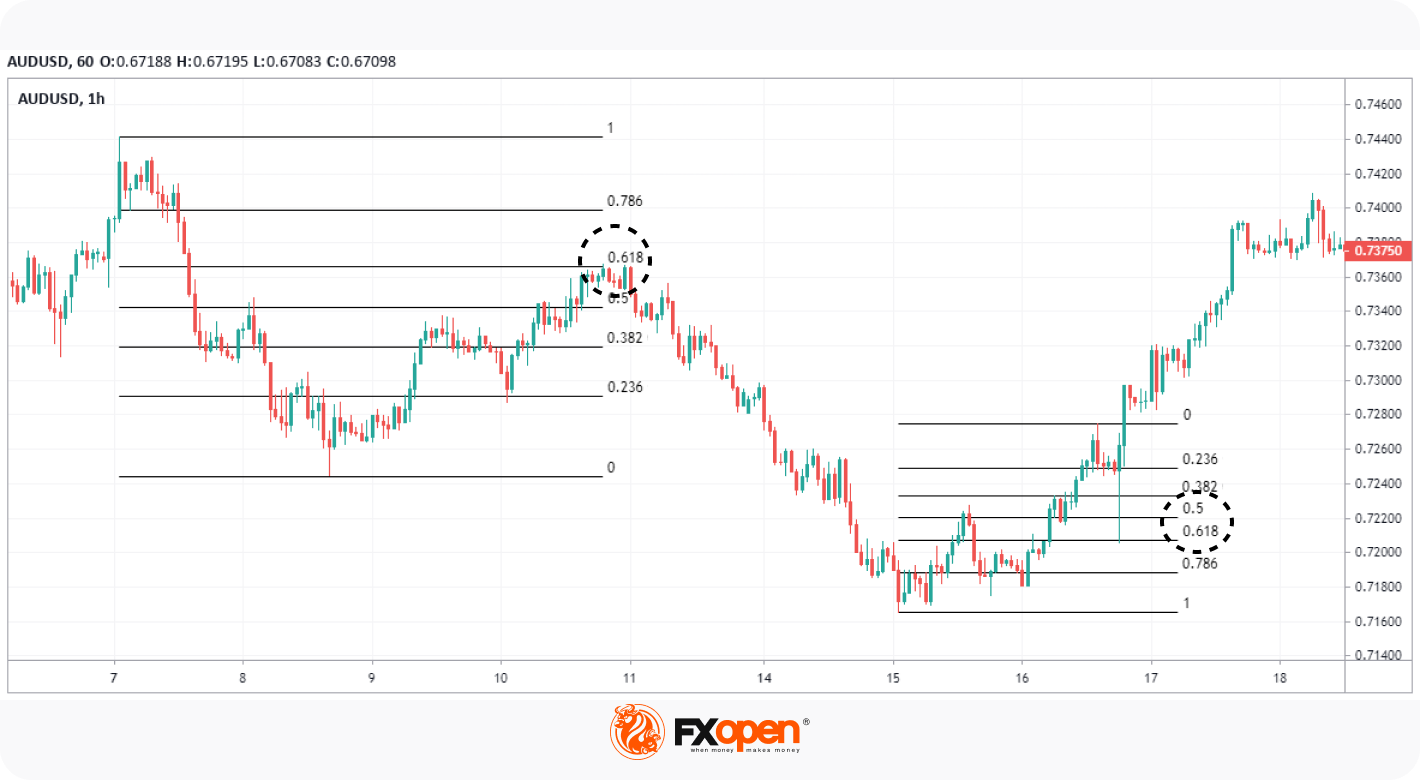
Lastly, many swing traders look to enter pullbacks in a larger trend. One of the most popular ways to identify optimum entry levels during these pullbacks is with the Fibonacci Retracement tool. Traders typically wait for a shift in price direction, then apply the tool to a swing high and swing low. Then, they enter at a pullback, usually to the 0.5 or 0.618 levels, to profit from the continuation of the trend. As seen above, this strategy can offer ideal entry points for swing traders looking to get in early before a trend continues.
The Bottom Line
In summary, swing trading can be an ideal style for many would-be traders out there. Rather than spending hours in front of the screen each day, swing traders can take a more laid-back approach. However, while solid risk management skills and iron-clad discipline are necessary characteristics for any trader, they’re even more important for swing traders.
Ready to embark on your swing trading journey? You can try a free demo account with us at FXOpen to practise your skills and start building a strategy. Good luck!
*At FXOpen UK and FXOpen AU, Cryptocurrency CFDs are only available for trading by those clients categorised as Professional clients under FCA Rules and Professional clients under ASIC Rules, respectively. They are not available for trading by Retail clients.
This article represents the opinion of the Companies operating under the FXOpen brand only. It is not to be construed as an offer, solicitation, or recommendation with respect to products and services provided by the Companies operating under the FXOpen brand, nor is it to be considered financial advice.
Latest articles

Google Share Price Rose Post-market to a New All-time Record
Yesterday, after the close of the main trading session, a report on activities for the 1st quarter of Alphabet Inc. (Google's parent company) was published. The report was strong, exceeding investors' expectations.
→ Quarterly EPS = USD 1.89 (expected = USD 1.

S&P 500 Rebounds after Negative GDP News
Data released yesterday showed US GDP growth slowed to 1.6% in the first quarter of the year. According to ForexFactory: forecast = 2.2%, past value = 2.4%.
Reaction to the news sent the S&P 500 mini stock

GBP/USD And USD/CAD Daily Chart Outlook
GBP/USD is attempting a recovery wave from 1.2300. USD/CAD is consolidating and might aim for a move above the 1.3760 resistance zone.
Important Takeaways for GBP/USD and USD/CAD Analysis Today
· The British Pound started