


FXOpen

A double top is a popular technical analysis tool that allows traders to forecast a trend reversal. It’s one of the most common patterns and it can be easily found in any timeframe of any asset. Still, some traders confuse its signals. This FXOpen article will guide you through the fundamental trading rules of this formation.
What Is a Double Top Pattern?
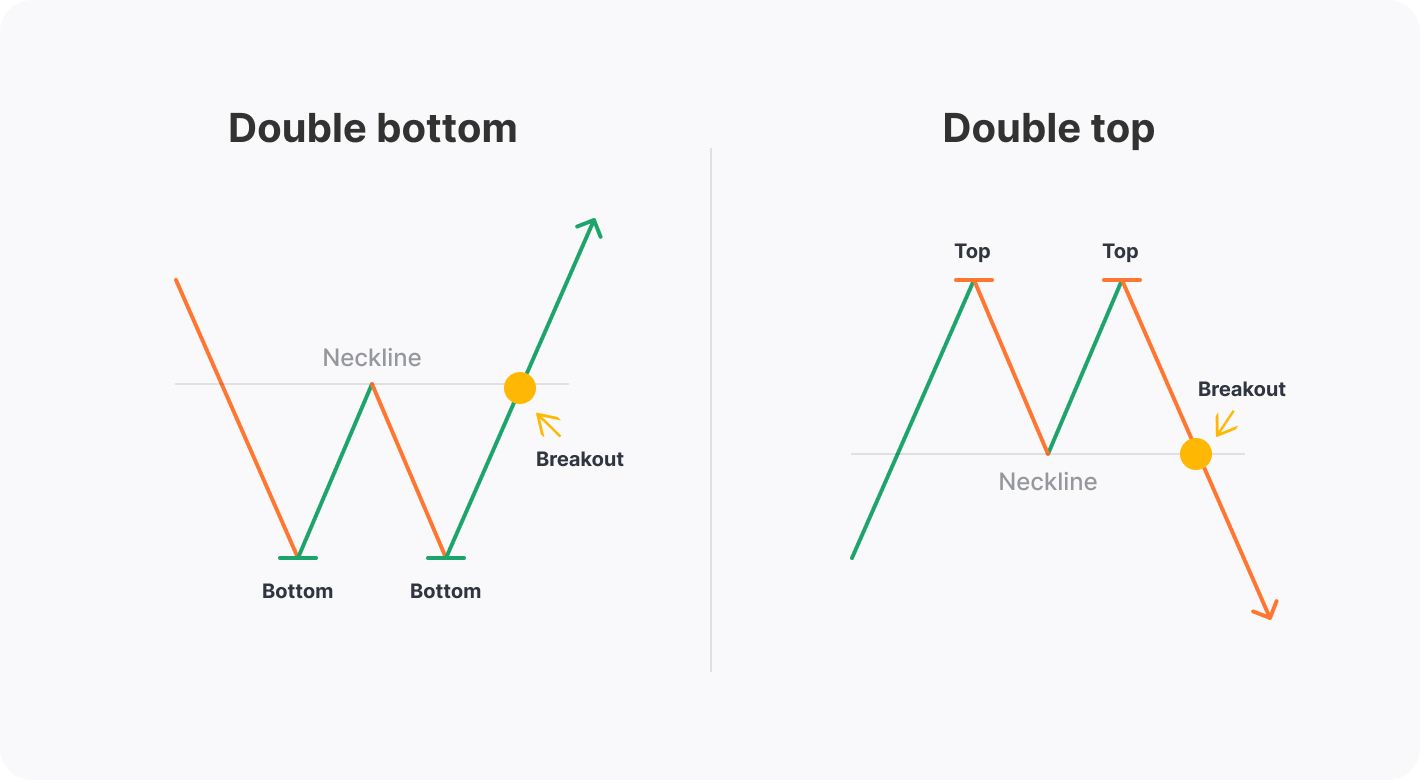
In technical analysis, a double top is a chart pattern that consists of two swing highs with a trough in between, and the two highs should be at the same or almost the same level. Some traders confuse a double top with a double bottom formation. Therefore, the question “Is the double top bullish or bearish?” is common. The double top pattern appears at the end of an uptrend, and it’s always bearish. Conversely, the double bottom setup occurs at the end of a downtrend, and it’s always bullish.
Another common question is, “What does double top mean in stocks?” Regardless of the market, the double top pattern forecasts a trend reversal. You can find this formation when trading stocks, commodities, cryptocurrencies*, and forex.
What Does a Double Top Indicate?
Understanding pattern psychology may help you learn how to spot it on a price chart. As a double top is a bearish formation, it occurs only in an upward trend. The first high indicates that the trend is in place. However, the second high, which appears at the same level, shows that bulls don't have the strength to push the price up further. Therefore, traders expect an end to the uptrend.
It's worth saying that on a stock chart, a double top formation will have the same psychology behind it as on currency, commodity, and ETF charts.
How to Trade a Double Top Pattern
The pattern's entry and exit rules are relatively simple. Although they may vary depending on the timeframe you use or the trading approach you implement, the standard points can be considered fundamental.
Entry
The two tops aren’t as important as the trough between them. This serves as the threshold that signals whether a trend reversal is occurring. A trader draws a horizontal line through it and waits for the price to fall below it after the second high is formed.
There are several options that traders can consider before entering the market. They can sell just after the breakout occurs; this is at the double top breakout candlestick. They can wait for the candle to close. Additionally, they can wait for at least two candles to be formed in the breakout direction.
The choice depends on the timeframe and the risk approach. It’s risky to enter the market as soon as the breakout occurs because the price may turn around. The chances the breakout is valid increase when the candle closes below the neckline. If the timeframe is high, traders can even wait for the price to form a few candles. However, measuring the take-profit target and considering trading volumes is vital.
Take Profit
A take-profit level is determined by measuring the distance between the tops and the neckline. The theory says the price will go the distance equal to the difference between the neckline and the tops.
Stop Loss
A stop-loss level can be calculated using the risk/reward ratio. The ratio is determined by considering the current market conditions, but it should be at least half the take-profit target. Additionally, it should always be placed above the neckline.
Note: there is a common rule that a support level becomes a resistance after the price falls below it. Conversely, a resistance level becomes support after the price rises above it.
This means that the neckline will turn into a resistance level after the breakout. A rise above it will signal either a market consolidation or a continuation of an uptrend.
Double Top: Trading Examples
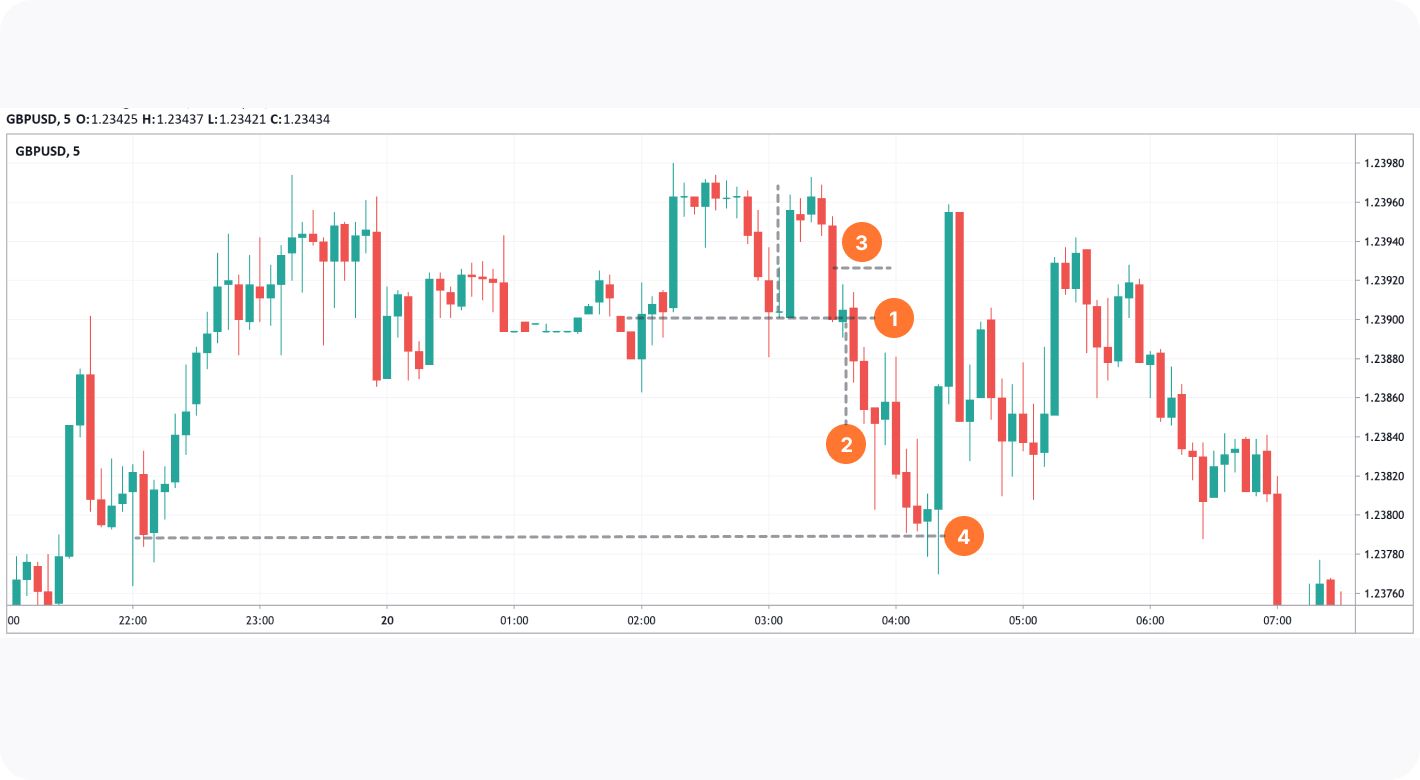
The chart above reflects a double top chart pattern formed on a 5-minute GBP/USD pair chart. The price tested the neckline after the breakout candlestick closed (1). However, if a trader used a stop-loss, they wouldn’t worry about the retest. The take-profit target would equal the distance between the tops and the neckline (2). As the tops aren’t high, a 1:2 risk/reward ratio would be too high, so a trader could use a 1:3 ratio (3). If fundamental analysis and high trading volumes confirmed a continuation of a price fall, a trader could use a trailing take-profit order and place the second target at the nearest support level (4).
The Difference Between a Double Top and a Failed Double Top
However, a double top pattern may fail like any other pattern or technical indicator.
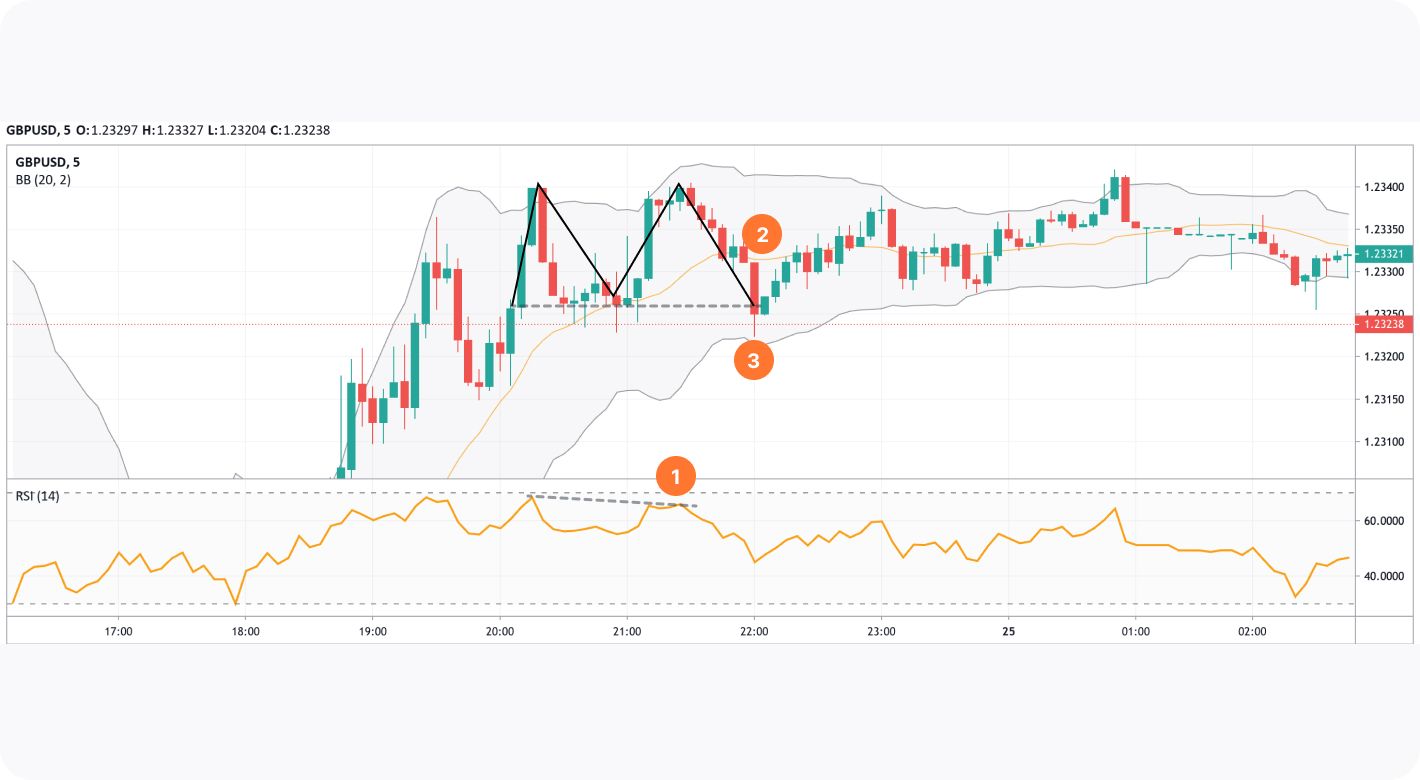
On the chart above, the price forms a double top pattern at the end of an uptrend. The RSI indicator has a bearish divergence with the price chart, which is supposed to confirm a price decline (1). After the second top, the price breaks below the middle line of the Bollinger Bands indicator (2), which is also a sign of a price decline. However, the pattern doesn’t work, and the price doesn’t reach the target (3).
How to Confirm a Double Top Pattern
The example above confirmed that the double top formation can’t provide signals that are 100% accurate. Moreover, it showed that even implementing additional tools when confirming the signals will not guarantee successful trades. Therefore, traders should practise constantly.
You can use the TickTrader platform to practise various combinations of the double top setup and technical analysis tools that can help confirm signals effectively.
Usually, traders look at volumes because a breakout is the pattern’s primary signal. If volumes rise when the price falls below the neckline, the chances the pattern will work are higher. Also, traders can use oscillators and trend indicators that can signal a trend reversal. Still, it's worth remembering that oscillator signals may have a short-term effect. Therefore, traders combine oscillators and trend indicators that may provide lagging signals but be more reliable when confirming a trend reversal.
Takeaway
A double top trading pattern is one of the most common formations that can be found on the price chart of any asset. You can open an FXOpen account and examine how it works. Remember to combine it with other technical analysis tools to increase the chance of a successful trade.
*At FXOpen UK, Cryptocurrency CFDs are only available for trading by those clients categorised as Professional clients under FCA Rules. They are not available for trading by Retail clients.
This article represents the opinion of the Companies operating under the FXOpen brand only. It is not to be construed as an offer, solicitation, or recommendation with respect to products and services provided by the Companies operating under the FXOpen brand, nor is it to be considered financial advice.
Latest articles

GBP/USD Bulls Struggle While USD/CAD Regains Strength
GBP/USD declined below the 1.2550 support zone. USD/CAD is rising and might aim for more gains above the 1.3760 resistance.
Important Takeaways for GBP/USD and USD/CAD Analysis Today
· The British Pound started a fresh

AUD/USD Analysis: Aussie Weakens After RBA Decision
Following its decision on 7th May, the Reserve Bank of Australia (RBA) opted to maintain the interest rate at 4.35%, despite inflation continuing to decrease at a slower pace than anticipated by the RBA.
"I think we still think
The Hang Seng Index Has Risen by Over 13% in 2 Weeks
Analyzing the Hang Seng (Hong Kong 50 at FXOpen) chart, we wrote on January 30th that the price was near an important support level formed by the lower boundary (shown in orange) of a long-term channel, which has been relevant