


FXOpen
This morning the USD/JPY rate is around 153.20 yen per US dollar, which was facilitated by a sharp strengthening of the dollar against the backdrop of news about inflation in the United States. Thus, the yen weakened to levels last seen in mid-1990.
At the same time, an important event occurred — a bullish breakdown of the level of 152 yen per US dollar. This level is special due to the fact that in 2022, the weakening of the exchange rate to 152 yen per US dollar forced the Bank of Japan and the Ministry of Finance to intervene three times, as Reuters writes, to support the yen.
In 2023, it also acted as a barrier to growth. It also held back the market during March 2024 and early April.
But yesterday the level of 152 yen per US dollar did not survive.
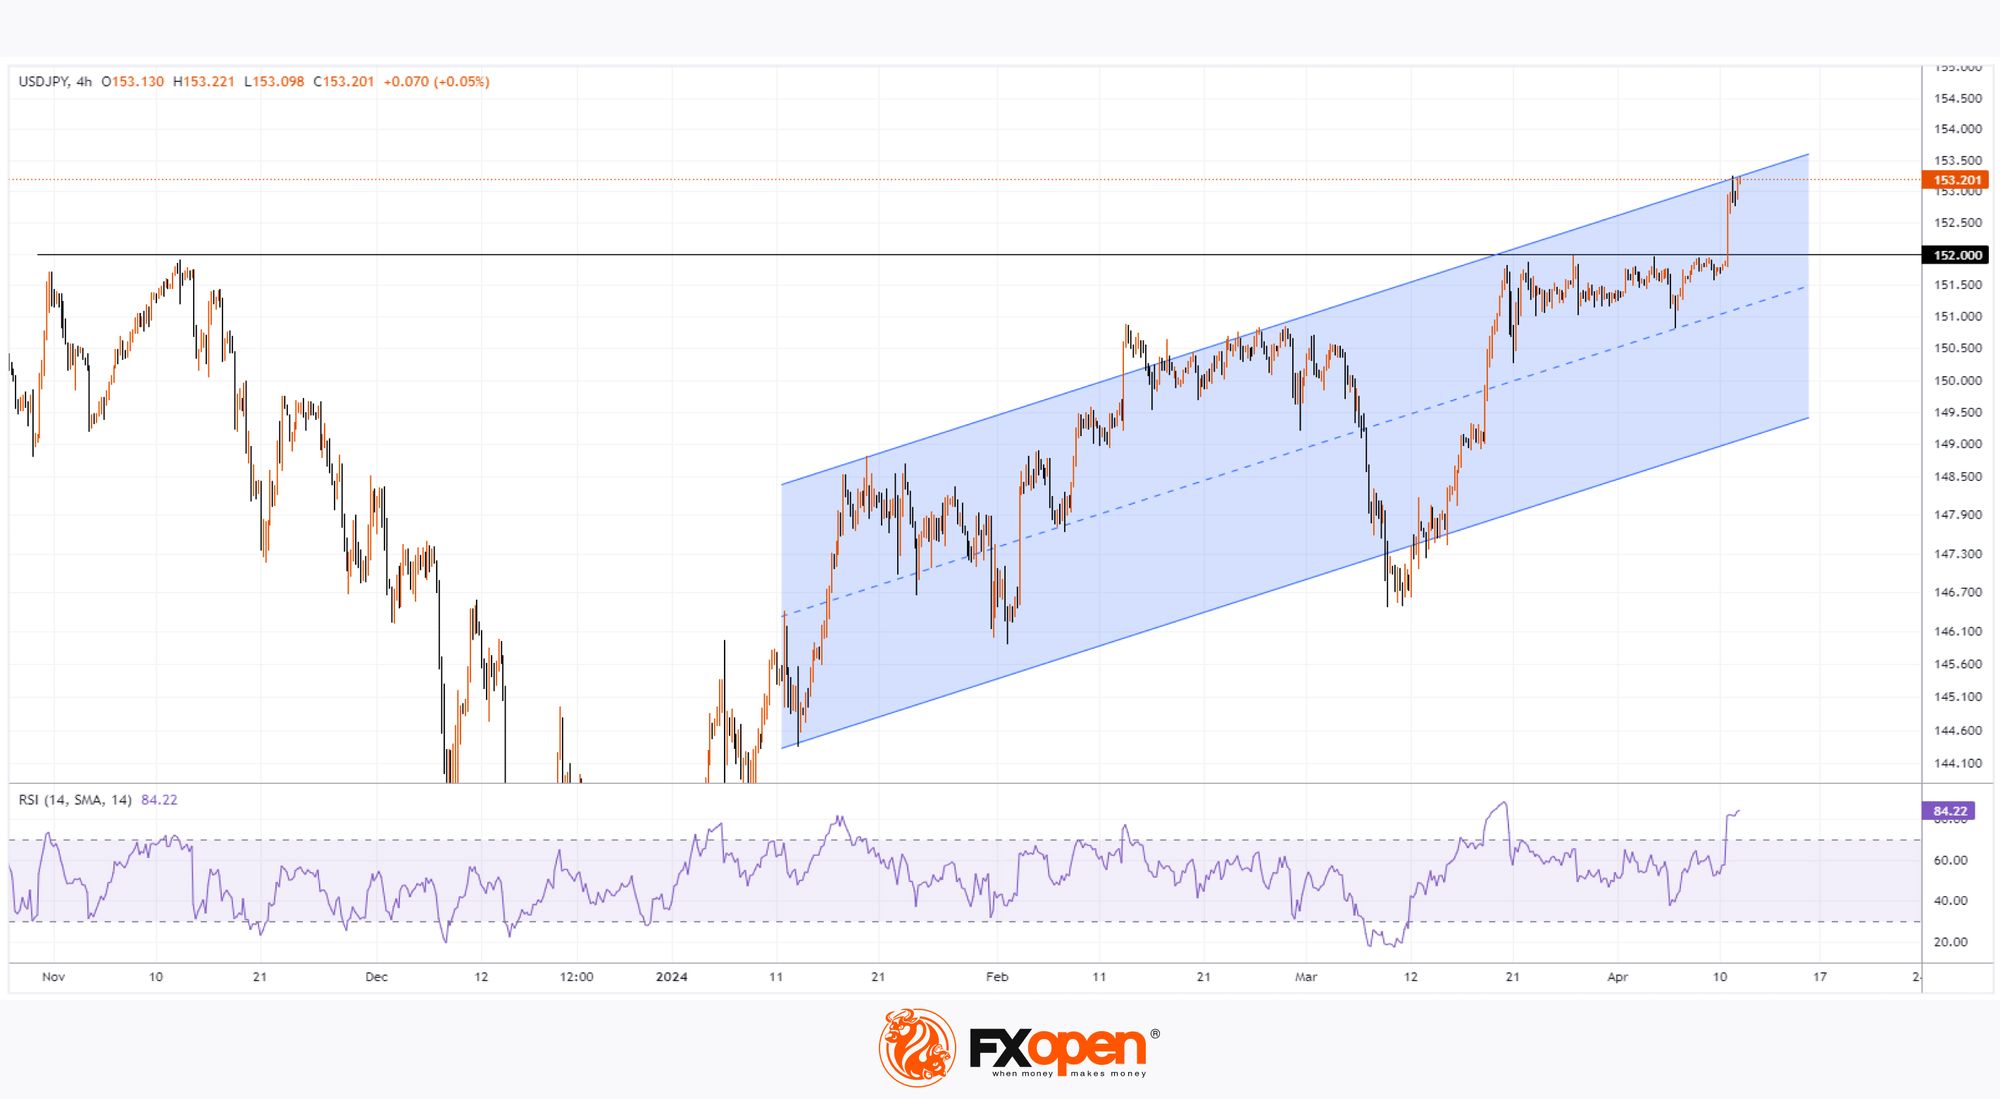
At the same time, technical analysis of the USD/JPY chart today shows that:
→ the price has reached the upper boundary of the ascending channel (shown in blue), now it demonstrates its role as resistance;
→ the RSI indicator indicates that the market is strongly overbought.
At the same time, it can be assumed that the likelihood of interventions has increased, since the Japanese authorities, as stated earlier, do not rule out any steps to combat excessive fluctuations.
Considering what was written above, it is possible to assume that the USD/JPY rate may form a pullback after a strong bullish impulse, and the level of 152 looks like new support.
Trade over 50 forex markets 24 hours a day with FXOpen. Take advantage of low commissions, deep liquidity, and spreads from 0.0 pips. Open your FXOpen account now or learn more about trading forex with FXOpen.
This article represents the opinion of the Companies operating under the FXOpen brand only. It is not to be construed as an offer, solicitation, or recommendation with respect to products and services provided by the Companies operating under the FXOpen brand, nor is it to be considered financial advice.
Latest from Forex Analysis
Latest articles

How to Identify and Trade Liquidity Grabs
Understanding the intricacies of market liquidity and the role of liquidity grabs can be crucial for optimising trading strategies. Liquidity grabs, creating rapid price movements, are a key component of Smart Money trading. This article explores how to identify these

What Is a Piercing Line Pattern, and How Can You Trade with It?
In the world of technical analysis, the piercing line pattern stands out as a solid indicator of potential market reversals. This article delves into the nuances of this two-candlestick pattern, exploring its formation, significance, and how traders can effectively leverage
London Calling! FTSE 100 Stocks Flying High Once Again
Back in 2021, which when looking at a physical calendar does not seem such a long time ago yet feels like an epoch ago when considering the changes in global economies and the capital markets since then, the FTSE 100