


FXOpen
UnitedHealth shares surged Tuesday, rising more than 5% after the health care giant delivered stronger-than-expected first-quarter 2024 results:
→ earnings per share: actual = USD 6.91, expected = USD 6.61, last quarter = USD 6.16;
→ gross income: actual = USD 94.4 billion, expected = USD 92.1 billion.
UnitedHealth CEO Andrew Whitty said health care costs rose sharply last year, and he attributed much of the rise to the effects of the Covid-19 pandemic.
Also adding positive news to investors was UnitedHealth Group's handling of the Feb. 21 cyberattack on its Change Healthcare subsidiary, which disrupted hospital and pharmacy operations for more than a week and cost an estimated USD 872 million.
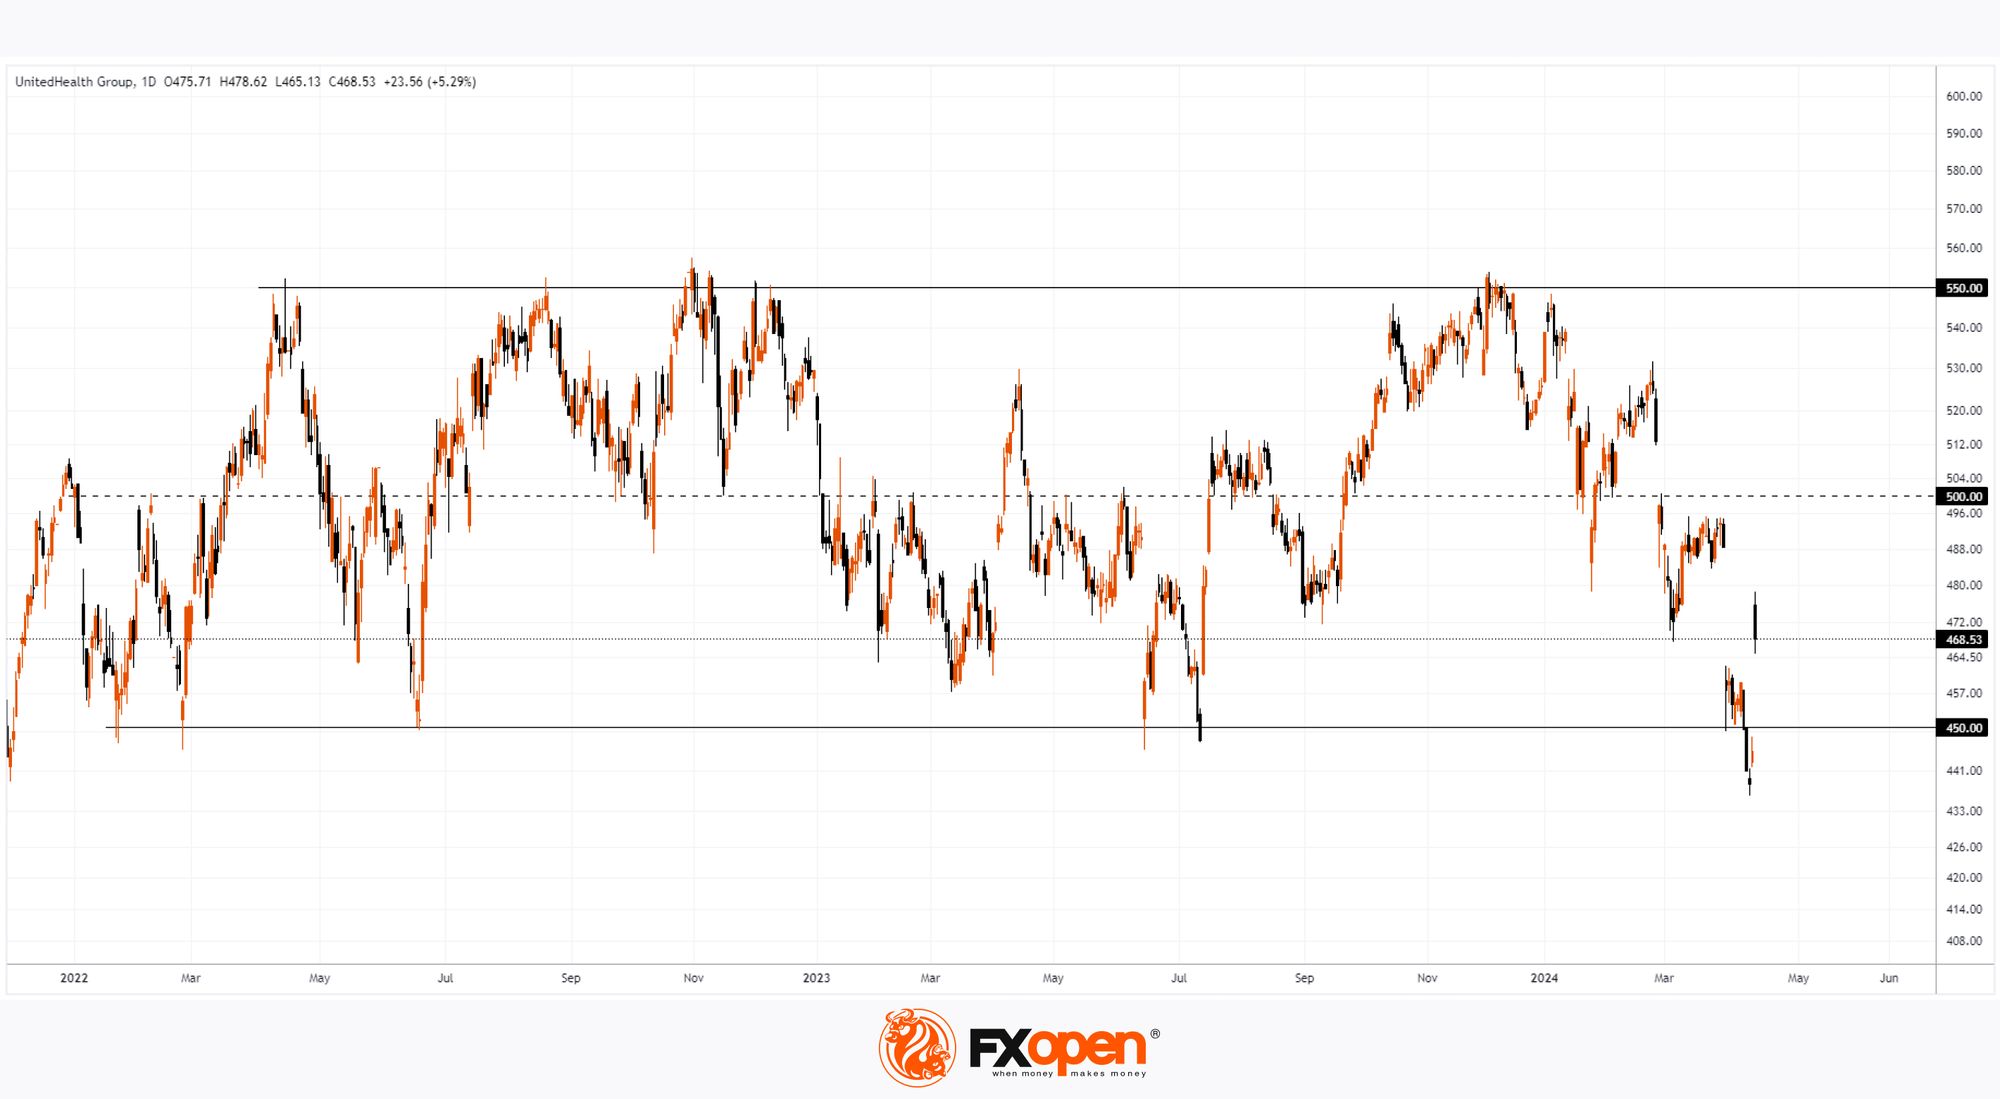
Technical analysis of the UNH stock chart shows that:
→ starting in 2022, the price moves within the range between support at USD 450 and resistance at USD 550 per share;
→ false breakouts of the indicated levels occurred repeatedly;
→ as a result of the publication of the report, another false breakdown of support was formed at USD 450 per UNH share;
→ growth after the report occurred with a gap in the area of USD 450-465, which can serve as support;
→ it is possible that a test of the gap will form on the chart and growth will at least reach the mid-channel level of USD 500 per share.
According to analysts surveyed by TipRank, the average price forecast for UMH shares is USD 591.29 in 12 months (more than +25% from the current price).
Buy and sell stocks of the world's biggest publicly-listed companies with CFDs on FXOpen’s trading platform. Open your FXOpen account now or learn more about trading share CFDs with FXOpen.
This article represents the opinion of the Companies operating under the FXOpen brand only. It is not to be construed as an offer, solicitation, or recommendation with respect to products and services provided by the Companies operating under the FXOpen brand, nor is it to be considered financial advice.
Latest from Shares
Latest articles

How to Identify and Trade Liquidity Grabs
Understanding the intricacies of market liquidity and the role of liquidity grabs can be crucial for optimising trading strategies. Liquidity grabs, creating rapid price movements, are a key component of Smart Money trading. This article explores how to identify these
What Is a Piercing Line Pattern, and How Can You Trade with It?
In the world of technical analysis, the piercing line pattern stands out as a solid indicator of potential market reversals. This article delves into the nuances of this two-candlestick pattern, exploring its formation, significance, and how traders can effectively leverage
London Calling! FTSE 100 Stocks Flying High Once Again
Back in 2021, which when looking at a physical calendar does not seem such a long time ago yet feels like an epoch ago when considering the changes in global economies and the capital markets since then, the FTSE 100