


FXOpen
As predicted by analysts, the European Central Bank did not change the interest rate yesterday, keeping it at = 4.50%. This morning the EUR/USD rate is near the psychological level of 1.0700, which approximately corresponds to the 2024 low.
The key driver of the euro's decline is the prospect that the ECB will take the path of easing monetary policy earlier than the Fed:
→ ECB President Christine Lagarde said yesterday that the decision “depends on the data, not on the Fed.”
→ As reported by Reuters, Max Stainton, senior global macro strategist at Fidelity International, believes that “the ECB will be the first central bank to start cutting rates this year.”
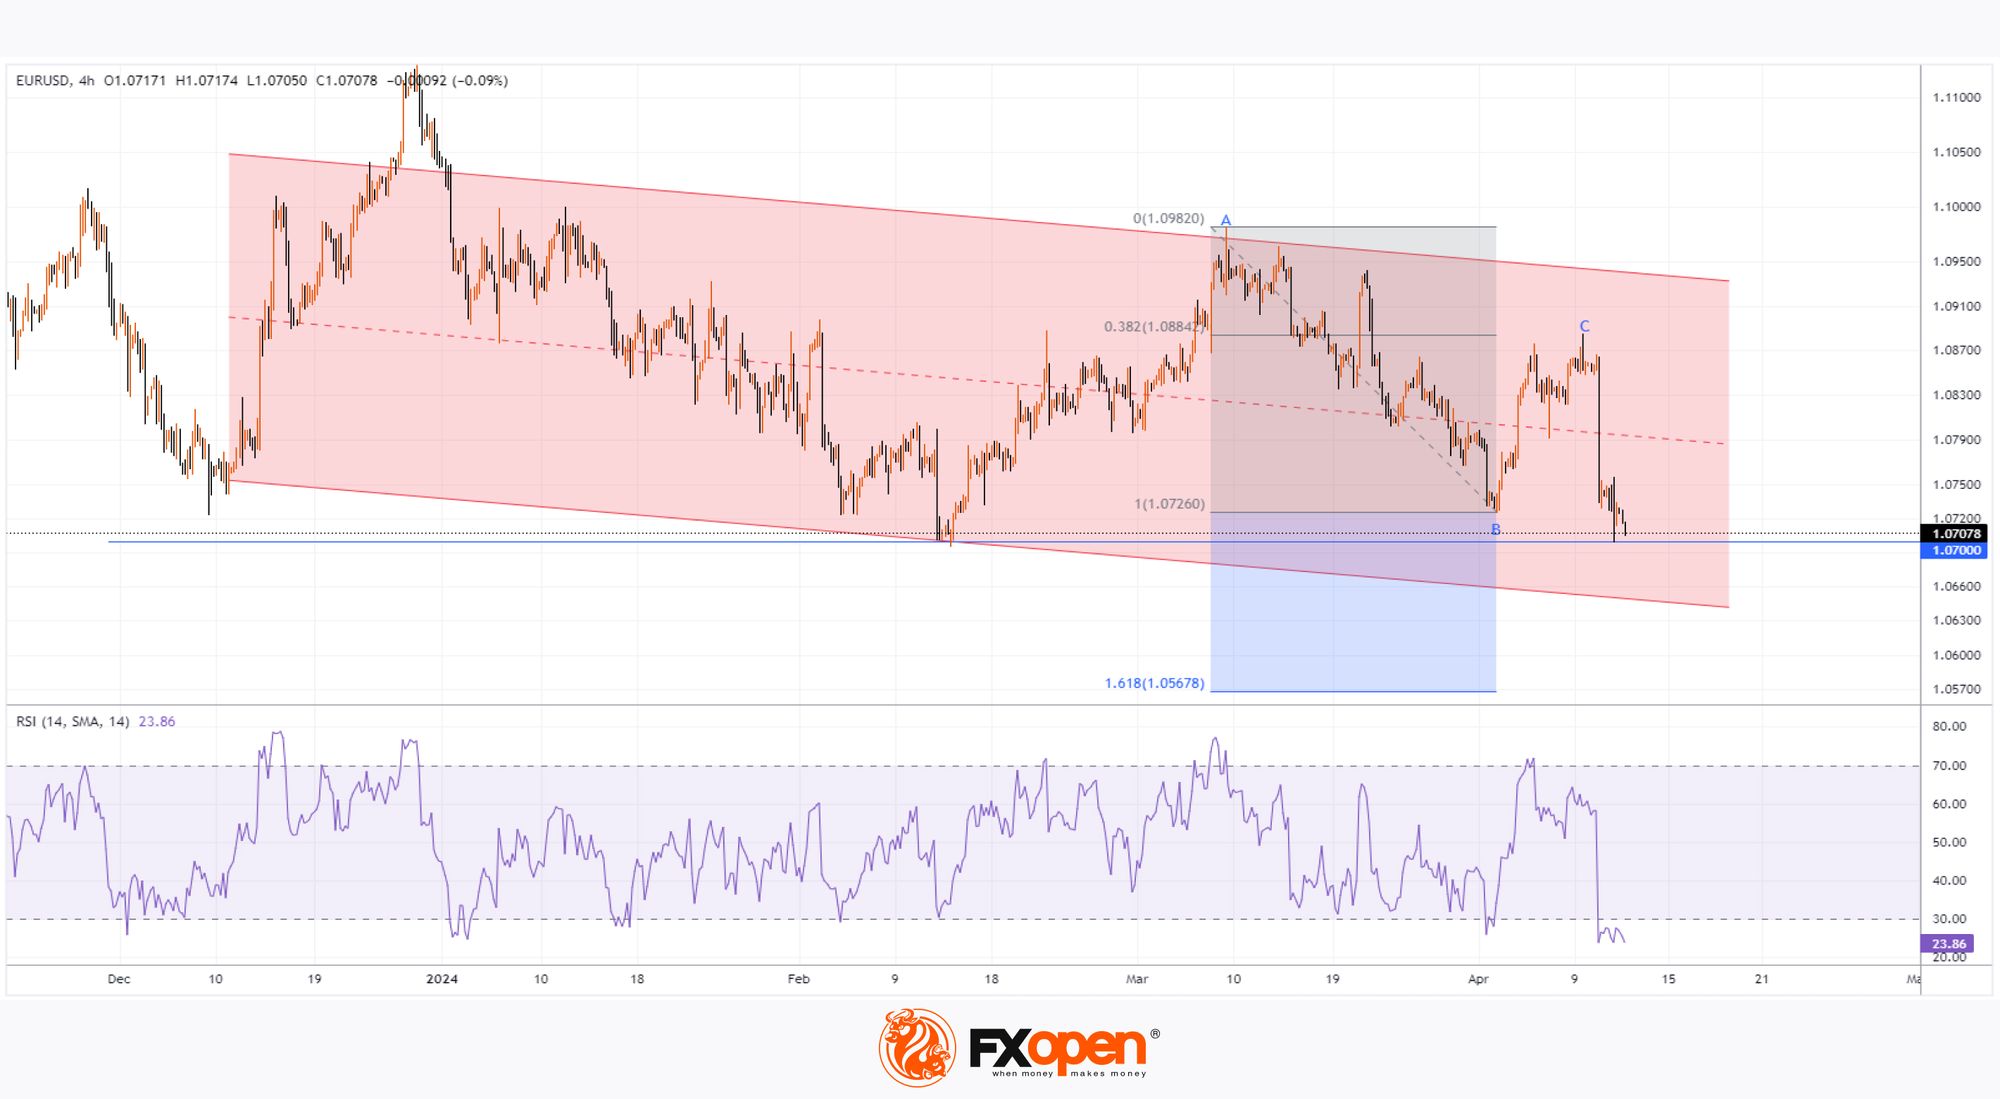
Technical analysis shows that:
→ the EUR/USD rate shows downward dynamics in 2024 (shown by the red channel);
→ the price is close to the lower border of the channel, but the downward impulse from top C (-1.6% since April 9) is holding back the level of 1.0700;
If we apply the Fibonacci proportions, then it is acceptable to assume that:
→ the upward movement B→C is an intermediate recovery after the downward impulse A→B (recovery completed at the level of 0.382);
→ the bears' target may be the Fibo level of 1.618, which corresponds to the rate of 1.05678 euros per dollar.
This goal can hardly be considered achievable in the near future, given that:
→ the market is oversold, as evidenced by RSI;
→ on the path of the bears there is support at 1.0700 and the lower border of the channel.
Trade over 50 forex markets 24 hours a day with FXOpen. Take advantage of low commissions, deep liquidity, and spreads from 0.0 pips. Open your FXOpen account now or learn more about trading forex with FXOpen.
This article represents the opinion of the Companies operating under the FXOpen brand only. It is not to be construed as an offer, solicitation, or recommendation with respect to products and services provided by the Companies operating under the FXOpen brand, nor is it to be considered financial advice.
Latest from Forex Analysis
Latest articles

How to Identify and Trade Liquidity Grabs
Understanding the intricacies of market liquidity and the role of liquidity grabs can be crucial for optimising trading strategies. Liquidity grabs, creating rapid price movements, are a key component of Smart Money trading. This article explores how to identify these

What Is a Piercing Line Pattern, and How Can You Trade with It?
In the world of technical analysis, the piercing line pattern stands out as a solid indicator of potential market reversals. This article delves into the nuances of this two-candlestick pattern, exploring its formation, significance, and how traders can effectively leverage
London Calling! FTSE 100 Stocks Flying High Once Again
Back in 2021, which when looking at a physical calendar does not seem such a long time ago yet feels like an epoch ago when considering the changes in global economies and the capital markets since then, the FTSE 100