


FXOpen

Bitcoin was unable to continue its bullish momentum from last week, and after touching a high of $29,829 on May 06, we can see a continuous decline in the bitcoin price, with immediate targets located in the range of $26500 and $27000.
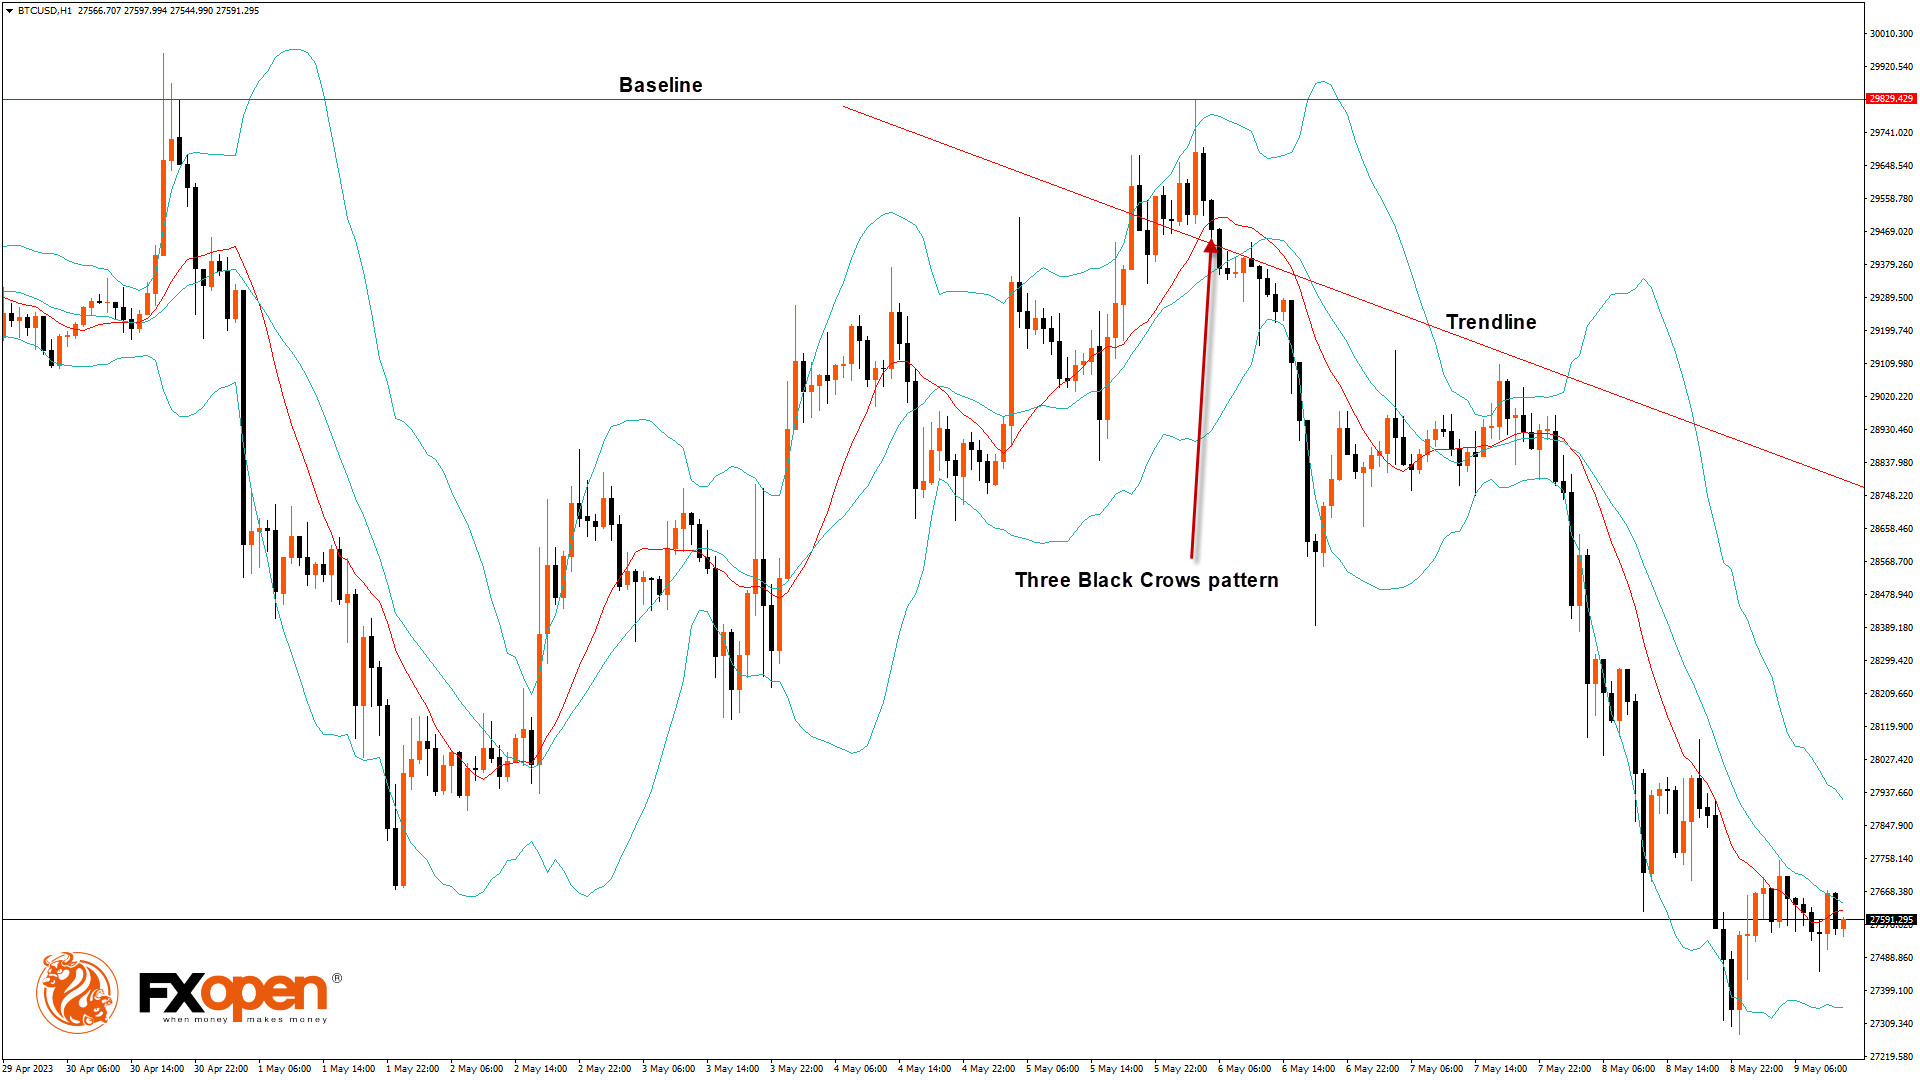
We can clearly see a bearish three black crows pattern below the $29,829 handle on the H1 timeframe.
The price of Bitcoin continues to move in a bearish momentum, which is expected to continue towards the $27,000 handle.
Both the STOCH and Williams’s percent range indicate overbought levels, which means that in the immediate short term, a decline in the price is expected.
The Bitcoin chart is ranging near a new record low for 1 month.
The relative strength index is at 39.90, indicating a very weak demand for Bitcoin and the continuation of the selling pressure in the markets.
Bitcoin is now moving below its 100-hour exponential moving average and below its 200-hour exponential moving average.
Most of the major technical indicators are giving a bearish signal, which means that in the immediate short term, we are expecting targets of $26,500 and $27,000.
The average true range indicates less market volatility with mild bearish momentum.
- Bitcoin bearish reversal is seen below $29,829.
- The RSI remains below 50, indicating a bearish market.
- The price is now trading below its pivot level of $27,622.
- The short-term range is mildly bearish.
- The momentum indicator is back under zero.
Bitcoin Bearish Reversal Seen below $29,829
The price of Bitcoin entered into a consolidation zone above the $27,000 handle after which we can see the continuation of the bearish moves.
There is a bullish trend reversal pattern with adaptive moving average AMA-20 and AMA-50 in the daily timeframe.
We can see the formation of bearish engulfing lines in the 4-hourly timeframe.
We have also seen a bearish harami cross pattern located in the 15-minutes timeframe.
A support zone is located at $26,092, which is a 61.8% retracement from the 52 week low, and at $26,670, which is a 3-10 day MACD oscillator stalls .
BTCUSD is now facing its classic support level of $27,454 and Fibonacci resistance level of $27,583 breaking which the price will be able to move to $27,000.
There is an increase of 3.08% in the daily trading volume, which is normal. The short-term outlook for Bitcoin is bearish, the medium-term outlook has turned bearish, and the long-term outlook remains neutral under present market conditions.
The Week Ahead
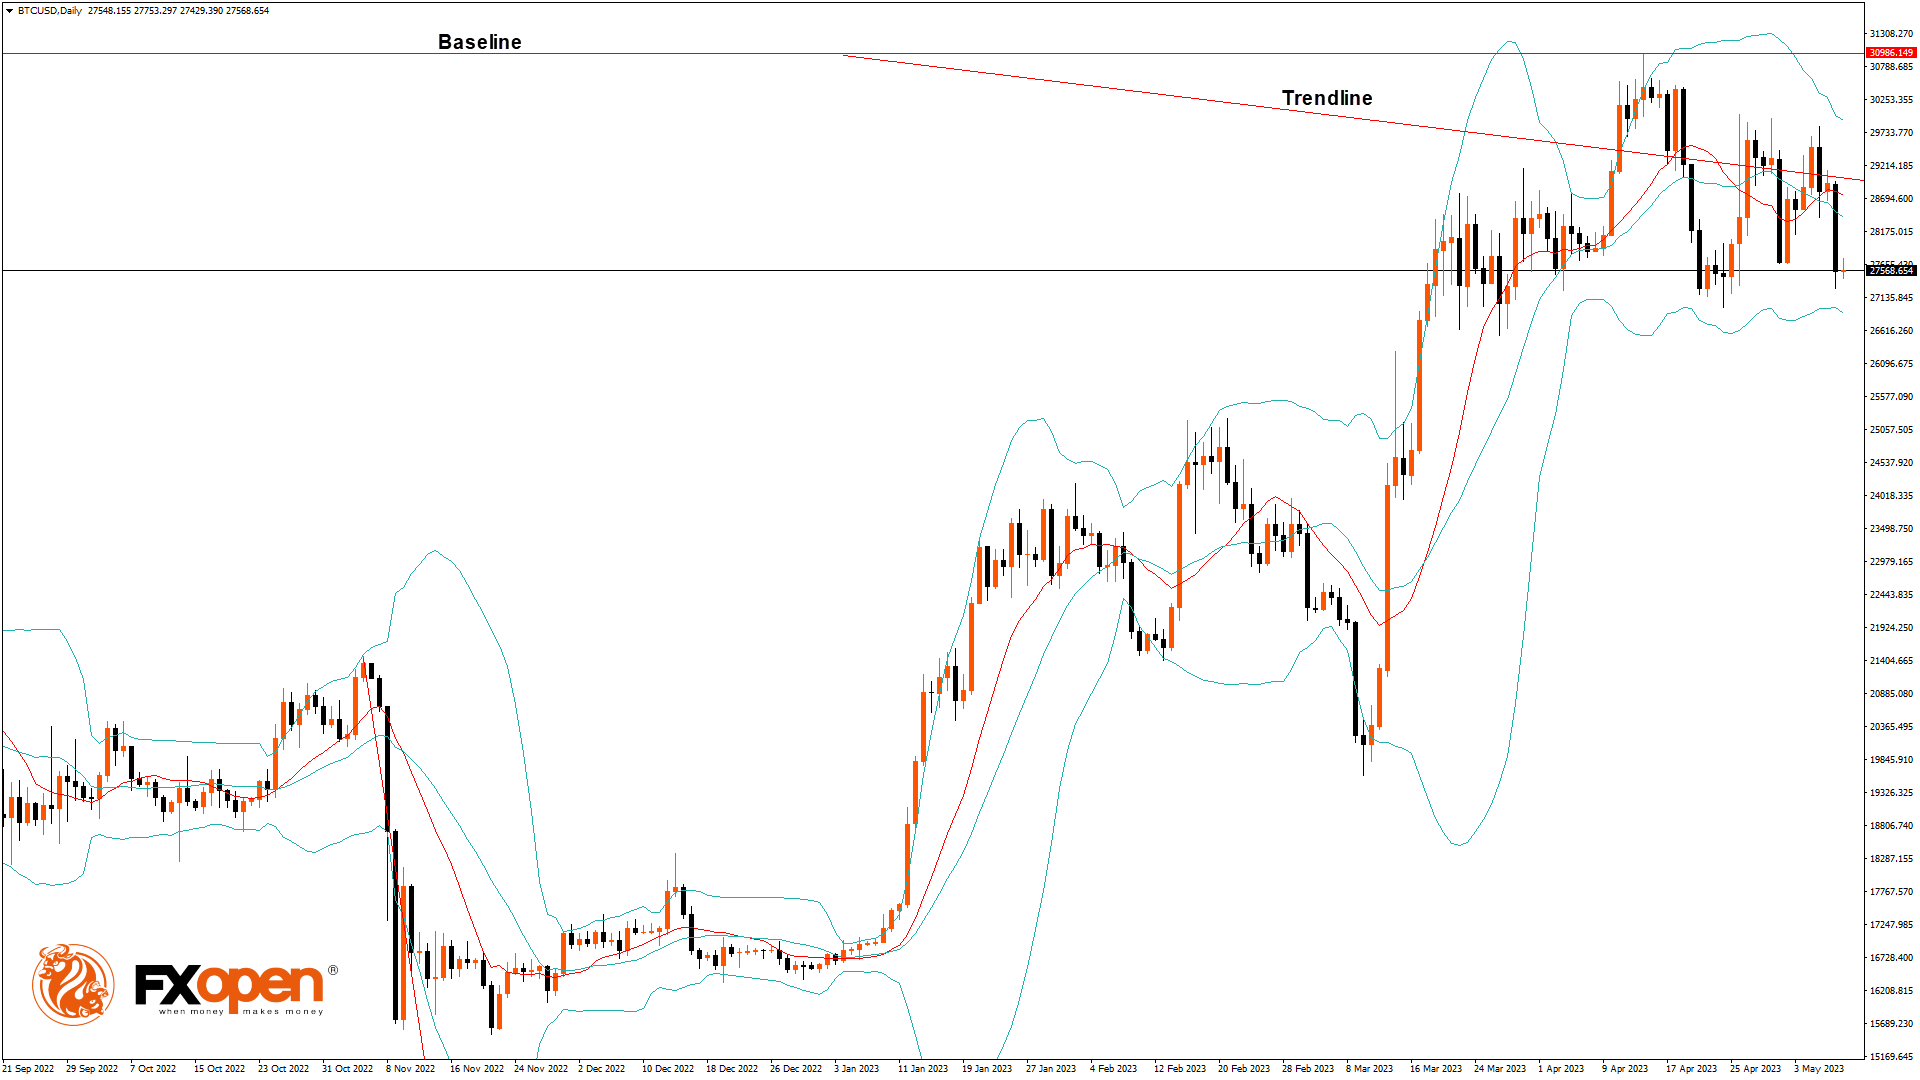
We can see that Bitcoin price remains well supported above the $27,000 handle and the continuation pattern is seen, with the current support at $25,281, which is a 50% retracement from 13 week high/low.
The immediate expected target is $26,500, after which we may see some consolidation in the zone of the $27,000 level.
Monthly RSI is at 49.79, which indicates the Neutral market and the shift towards the consolidation zone in the medium-term range.
We can see the formation of a bearish trend line from $29,829 to $27,356.
The BTCUSD is now facing resistance at $28,051, which is a 14-3 day raw stochastic at 30%, and at 28,266 which is a 14 day RSI at 50%.
This article represents the opinion of the Companies operating under the FXOpen brand only. It is not to be construed as an offer, solicitation, or recommendation with respect to products and services provided by the Companies operating under the FXOpen brand, nor is it to be considered financial advice.
FXOpen offers the world's most popular cryptocurrency CFDs*, including Bitcoin and Ethereum. Floating spreads, 1:2 leverage — at your service. Open your trading account now or learn more about crypto CFD trading with FXOpen.
*At FXOpen UK and FXOpen AU, Cryptocurrency CFDs are only available for trading by those clients categorised as Professional clients under FCA Rules and Professional clients under ASIC Rules respectively. They are not available for trading by Retail clients.
This article represents the opinion of the Companies operating under the FXOpen brand only. It is not to be construed as an offer, solicitation, or recommendation with respect to products and services provided by the Companies operating under the FXOpen brand, nor is it to be considered financial advice.
Latest articles

Japanese Yen Goes on Volatility Drive after US Economic Uncertainty Surfaces
The Japanese yen has been notably volatile for a long time now, and today, that dynamic continues as the yen made some tremendous steps forward over the course of the Asia Pacific trading session.
In today's Asia Pacific trading session,

What Are the Inner Circle Trading Concepts?
Inner Circle Trading (ICT) offers a sophisticated lens through which traders can view and interpret market movements, providing traders with insights that go beyond conventional technical analysis. This article explores key ICT concepts, aiming to equip traders with a thorough

What Did Buffett Say at the Shareholders' Meeting?
Warren Buffett, aged 93, held his first Berkshire Hathaway shareholders' meeting this weekend without Charlie Munger, his longtime partner at Berkshire Hathaway, who passed away at the age of 99.
Following the meeting, it was revealed that Berkshire Hathaway's cash