


FXOpen

Technical analysis changed dramatically when the Japanese approach was introduced to the Western world. To the astonishment of many Western technical analysts, it turns out that forecasting prices is a centuries-old concept in Japan.
Hammer Candlestick Pattern in Technical Analysis
With roots back to 1700, Japanese candlesticks techniques fascinated the Western world since the 1990s when Steve Nison wrote its famous candlesticks book. The simplicity and accuracy of the concepts blown away even the most skeptical technical trader.
Since their introduction, the candlesticks chart quickly became the most popular among traders. The concept of a candlestick is simple and easy to understand. It has:
- a real body
- the distance from the opening to closing prices of a period
- it can be either bullish (typically green) or bearish (generally red)
- shadows
- upper shadow
- the distance from the opening price all the way to the highest point in the candlestick
- lower shadow
- the distance from the closing price to the lowest point in the candlestick
- upper shadow
The interpretation of Japanese candlesticks is simple and straightforward. Most of them being reversal patterns, it is easy to understand why they appeal to today’s traders.
Moreover, most of the patterns have only two or three candlesticks, in sharp contrast with classic technical analysis patterns that are time-consuming (e.g., head and shoulders, flags).
One of the most potent, single-candlestick patterns is the hammer.
What is the Hammer Pattern?
A hammer is a reversal pattern. More precisely, a bullish reversal pattern.
It forms at the bottom of bearish trends, so the presence of a bearish trend is mandatory. If the market doesn’t fall before the hammer candlestick, that’s not a reversal pattern.
All reversal patterns part of the Japanese candlesticks techniques show a battle. The market struggles at critical points, and bulls and bears fight for supremacy when a hammer candlestick forms.
A hammer candlestick has a tiny real body, either bullish or bearish. In other words, the color of the real body doesn’t matter.
More importantly, the lower shadow must exceed at least two times the real body’s size. Hence, before jumping to conclusion and judging a candlestick as a hammer, make sure you measure the real body’s length and check that the lower shadow is longer than two times the result. Just like the chart below shows!
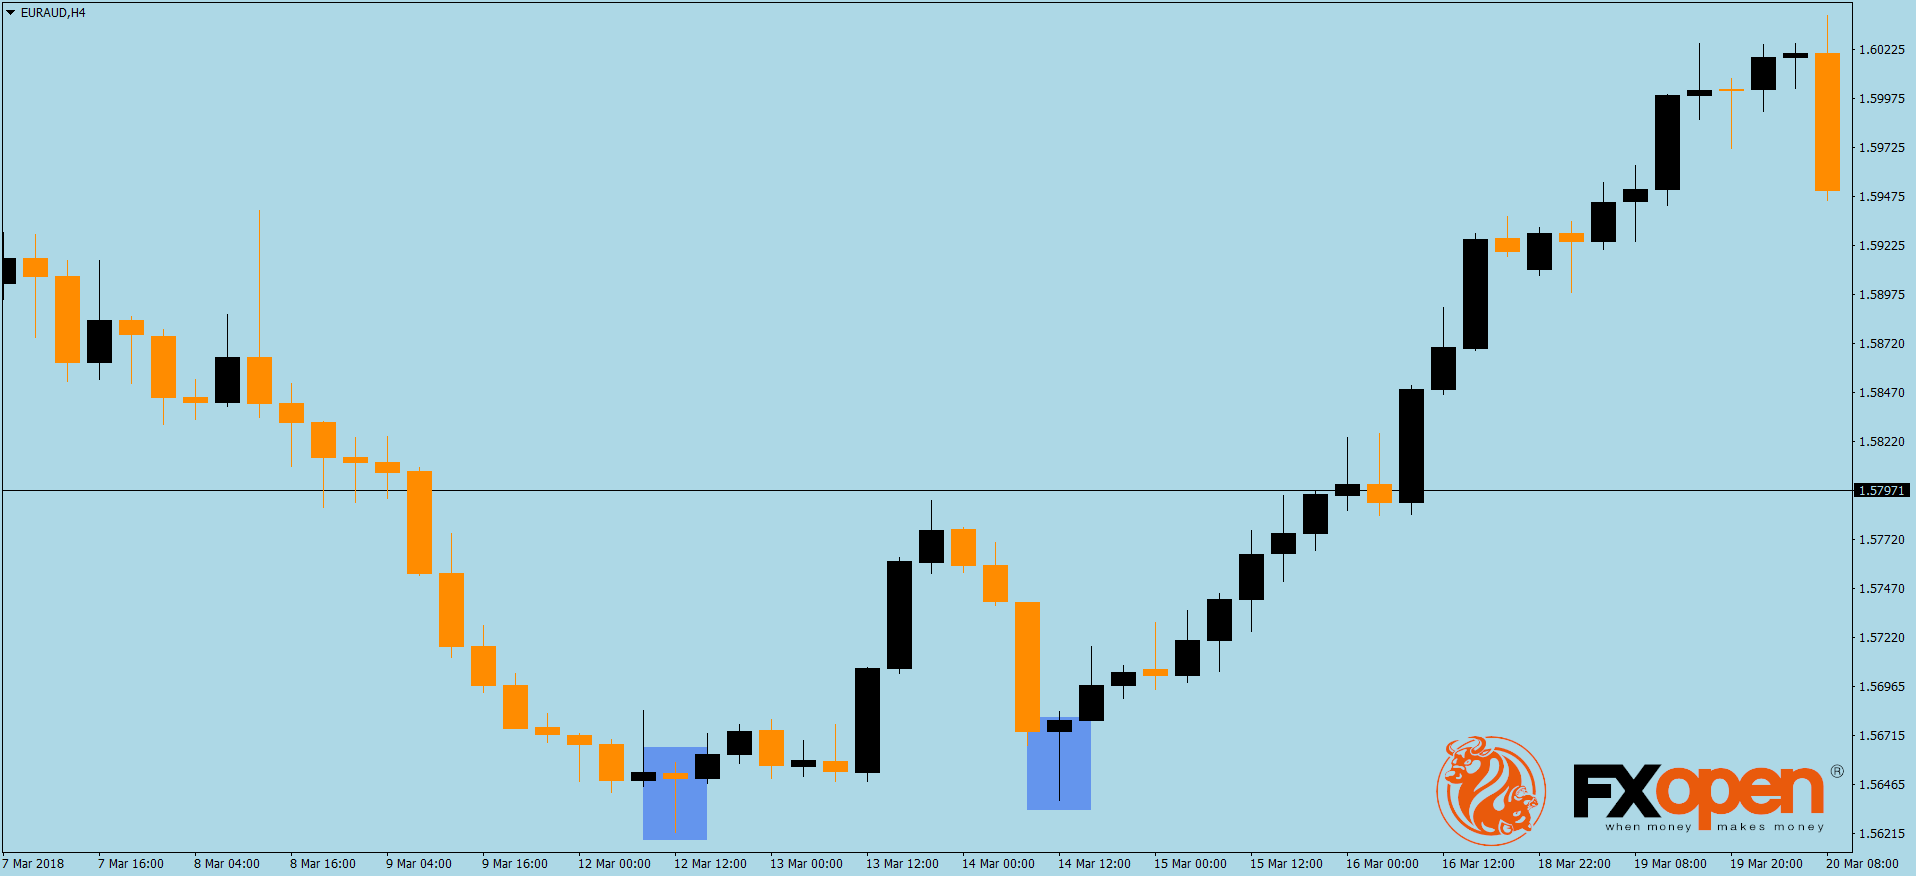
Focus on the highlighted areas. The first one from the left is a bearish candlestick that has a small real body. The shadow exceeds two times the body.
The same is valid in the case of the second example. Both candlesticks are hammer patterns, but savvy traders won’t trade the second one. Only the first one! How come?
Remember that the hammer’s presence is signaled by the existence of a bearish trend? In the second example, there’s no previous bearish trend, but in the first instance, there is.
Because the hammer is a reversal patterns, bears will always try to override bulls. Therefore, a pullback is mandatory when trading it.
How to Trade the Hammer Pattern
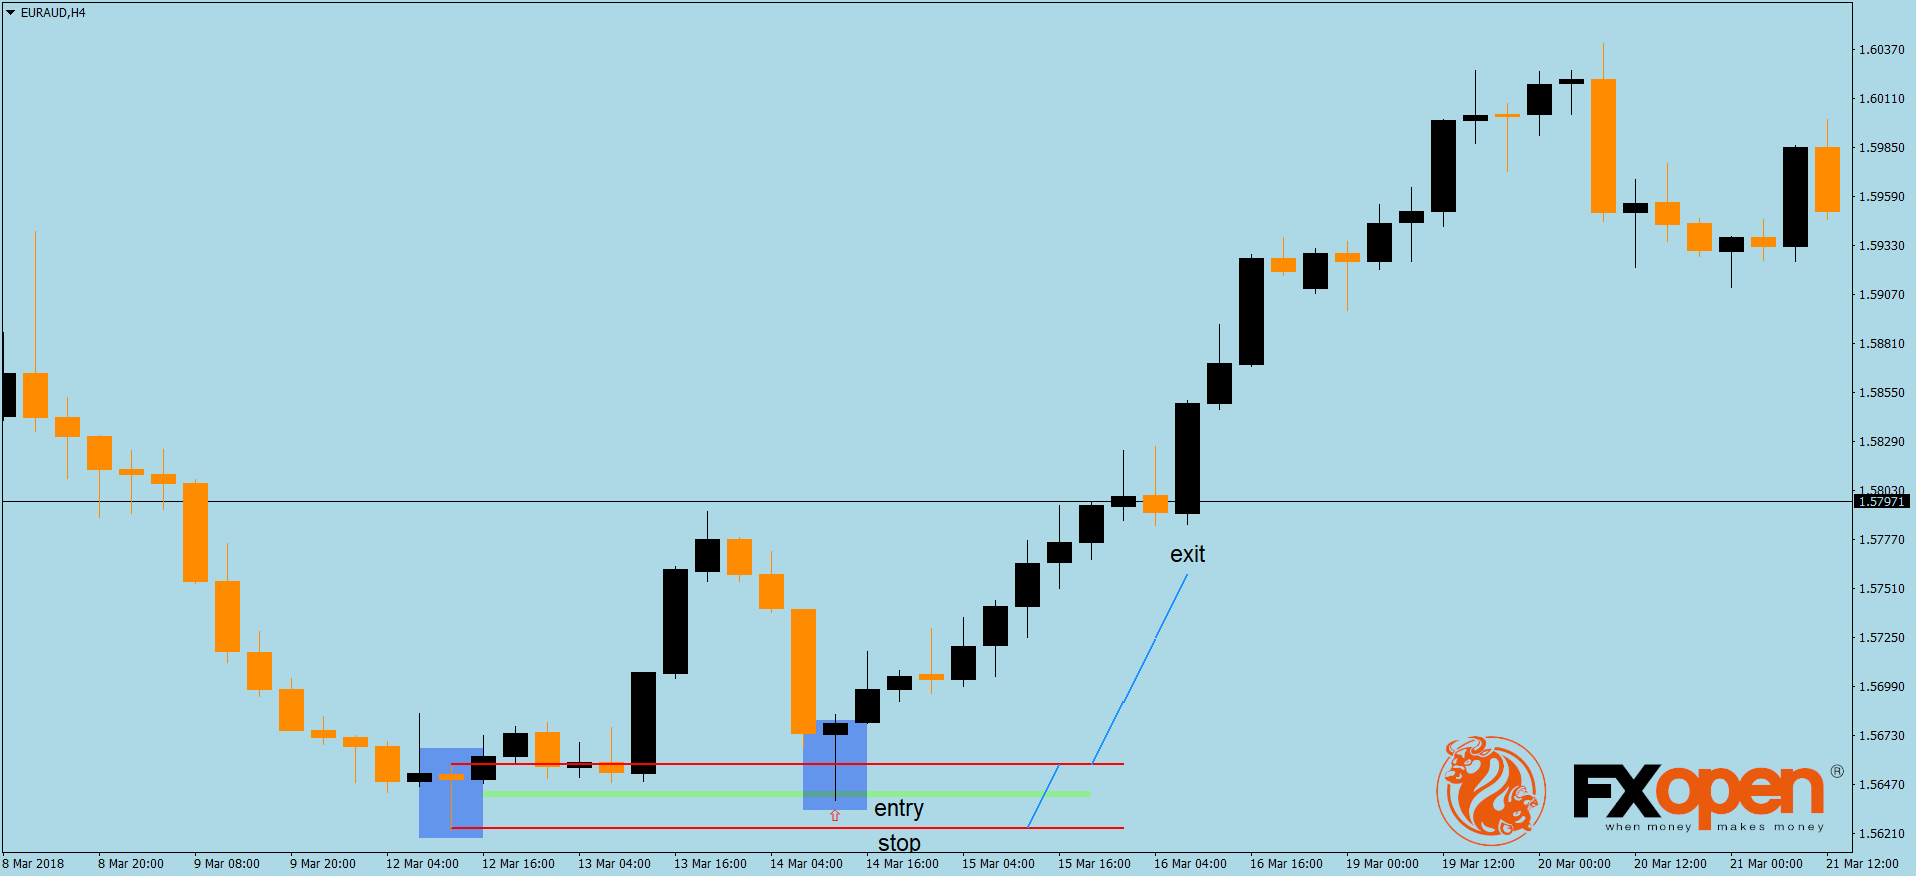
Trading the hammer follows a simple plan:
- measure the candlestick from top to bottom
- wait for a pullback into 50%
- go long with a stop-loss order at the bottom
- target three times the length of the hammer candlestick, for a resulting risk-reward ratio that exceeds 1:3
Conclusion
The hammer is a bullish pattern, but a similar, bearish pattern does exist. Its correspondent on the bearish side is a shooting star, a candlestick with a small real body and a long upper shadow.
Its interpretation is similar to the hammer, only that it forms at the end of a bullish trend and traders go short after spotting it.
The shooting star is the simplest of the star formations part of the Japanese candlesticks patterns. More about other star formations, in future articles part of this blog.
This article represents the opinion of the Companies operating under the FXOpen brand only. It is not to be construed as an offer, solicitation, or recommendation with respect to products and services provided by the Companies operating under the FXOpen brand, nor is it to be considered financial advice.
Latest articles

Google Share Price Rose Post-market to a New All-time Record
Yesterday, after the close of the main trading session, a report on activities for the 1st quarter of Alphabet Inc. (Google's parent company) was published. The report was strong, exceeding investors' expectations.
→ Quarterly EPS = USD 1.89 (expected = USD 1.

S&P 500 Rebounds after Negative GDP News
Data released yesterday showed US GDP growth slowed to 1.6% in the first quarter of the year. According to ForexFactory: forecast = 2.2%, past value = 2.4%.
Reaction to the news sent the S&P 500 mini stock

GBP/USD And USD/CAD Daily Chart Outlook
GBP/USD is attempting a recovery wave from 1.2300. USD/CAD is consolidating and might aim for a move above the 1.3760 resistance zone.
Important Takeaways for GBP/USD and USD/CAD Analysis Today
· The British Pound started