


FXOpen

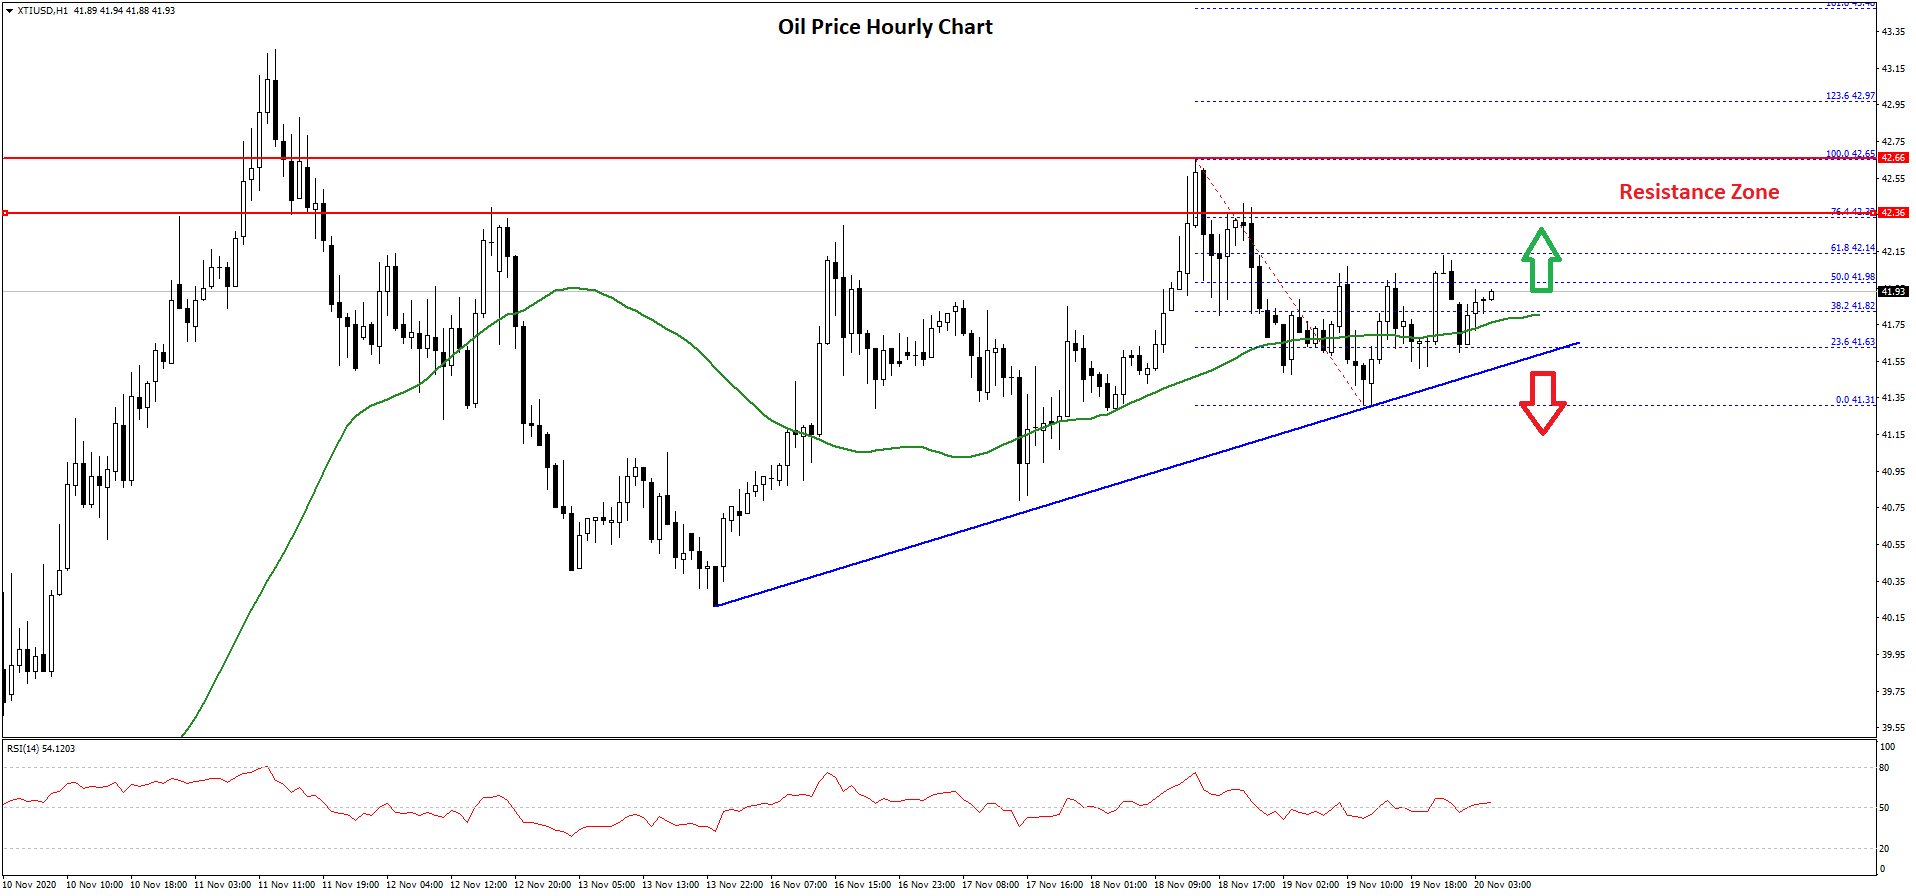
Gold price failed to clear the $1,900 resistance and declined towards $1,855. Conversely, crude oil price is rising and it is showing positive signs above $41.50.
Important Takeaways for Gold and Oil
- Gold price declined below the $1,880 and $1,865 support levels against the US Dollar.
- There is a major bearish trend line forming with resistance near $1,878 on the hourly chart of gold.
- Crude oil price is currently consolidating gains above the $41.00 and $41.50 support levels.
- There is a key bullish trend line forming with support near $41.60 on the hourly chart of XTI/USD.
Gold Price Technical Analysis
Gold price topped near the $1,900 level and started a steady decline against the US Dollar. The price broke the $1,895 and $1,880 support levels to move into a bearish zone.
The price even broke the $1,865 support level and settled well below the 50 hourly simple moving average. It traded close to the $1,850 level and a low is formed near the $1,852 on FXOpen. The price is currently correcting higher and trading above $1,860.
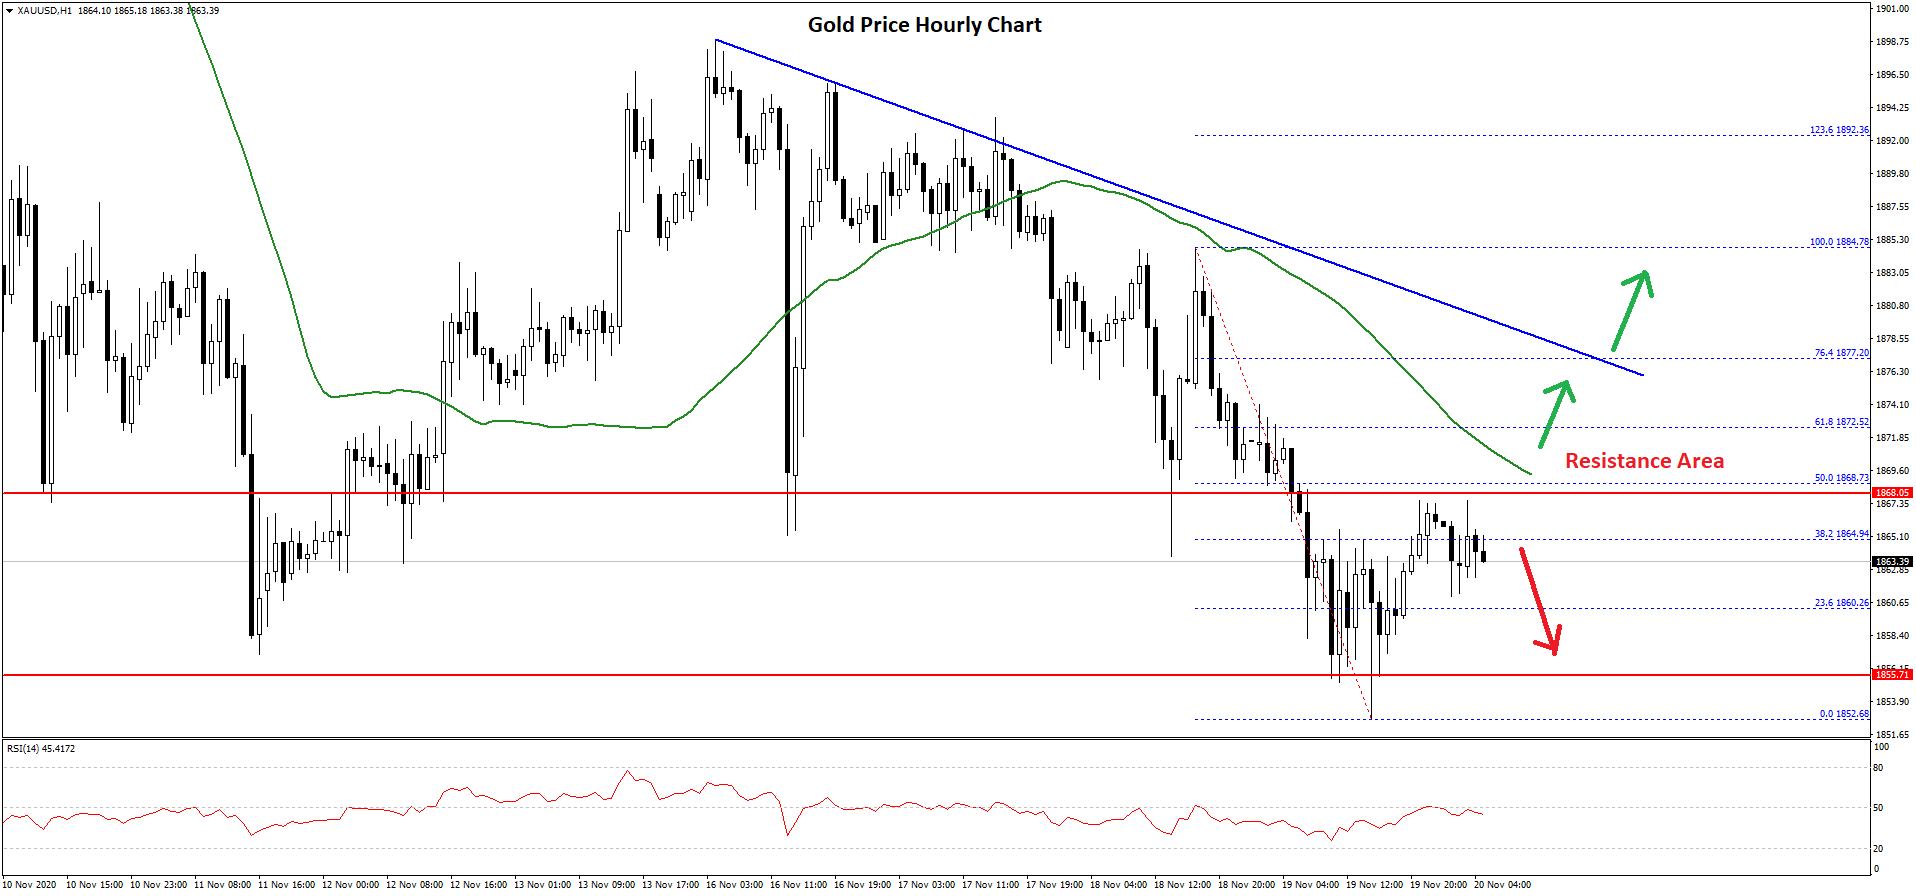
There was a break above the 38.2% Fib retracement level of the recent decline from the $1,884 swing high to $1,852 low. The price is now facing hurdles near the $1,865 and $1,868 levels.
The 50% Fib retracement level of the recent decline from the $1,884 swing high to $1,852 low is also acting as a resistance along with the 50 hourly simple moving average. More importantly, there is a major bearish trend line forming with resistance near $1,878 on the hourly chart of gold.
To start a decent recovery, the price must break the $1,868 level and the 50 hourly simple moving average. In the stated case, there are chances of an upside break above the trend line resistance and $1,880. The next major resistance sits at $1,895, followed by $1,900.
Conversely, the price could start a fresh decline below the $1,855 level. The next major support is near $1,850, below which there is a risk of a sharp decline towards $1,820.
Oil Price Technical Analysis
Crude oil price remained well bid above the $40.00 level and it climbed higher steadily against the US Dollar. The price broke the $41.00 resistance level to move further into a positive zone.
There was also a close above the $41.50 level and the 50 hourly simple moving average. The price tested the $42.60 resistance zone and a high was formed near $42.65 before the price corrected lower.
 oil
oil
It traded as low as $41.31 and it is currently rising. An initial resistance is near the $42.00 level. It coincides with the 50% Fib retracement level of the recent decline from the $42.65 high to $41.31 low.
The first major resistance is near the $41.35 level or the 76.4% Fib retracement level of the recent decline from the $42.65 high to $41.31 low. A close above the $41.35 resistance might increase the chances of more upsides above $41.65 and $42.00 in the near term.
On the downside, there is a key bullish trend line forming with support near $41.60 on the hourly chart of XTI/USD. A break below the trend line support could lead the price towards the $41.00 support or even $40.40.
Trade over 50 forex markets 24 hours a day with FXOpen. Take advantage of low commissions, deep liquidity, and spreads from 0.0 pips. Open your FXOpen account now or learn more about trading forex with FXOpen.
This article represents the opinion of the Companies operating under the FXOpen brand only. It is not to be construed as an offer, solicitation, or recommendation with respect to products and services provided by the Companies operating under the FXOpen brand, nor is it to be considered financial advice.
Latest from Forex Analysis
Latest articles

Trend Reversals and the Sushi Roll Reversal Pattern
Understanding trend reversals is essential for optimising trading and managing risks. This article delves into the concept of trend reversals, with a focus on the Sushi Roll reversal pattern—a sophisticated tool that helps traders anticipate significant market shifts—exploring

Rivian Stock Goes High as Q1 Report Anticipation Mounts
Being a newcomer within a very long-established and somewhat traditional global industry is not easy.
The automotive industry is a case in point. It has been over 139 years since Karl Benz managed to successfully produce the first motorised vehicle,

The US Labour Market Is Slowing Down. How Could This Impact Major Currency Pair Pricing?
A weak employment report in the US contributed to a sharp pullback in major currency pairs, but it hasn't led to a full change in major trends yet. For instance, nonfarm payroll figures showed that:
- The number of new jobs