


FXOpen

AUD/USD is eyeing a steady increase above the 0.6555 resistance. NZD/USD is also rising and could extend its increase above the 0.6000 resistance zone.
Important Takeaways for AUD/USD and NZD/USD Analysis Today
· The Aussie Dollar is moving higher from the 0.6465 zone against the US Dollar.
· There is a connecting bullish trend line forming with support at 0.6555 on the hourly chart of AUD/USD at FXOpen.
· NZD/USD is showing positive signs above the 0.5925 support.
· There is a key bullish trend line forming with support at 0.5940 on the hourly chart of NZD/USD at FXOpen.
AUD/USD Technical Analysis
On the hourly chart of AUD/USD at FXOpen, the pair formed a base above 0.6465. The Aussie Dollar started another recovery wave above the 0.6510 resistance against the US Dollar
The bulls pushed the pair above the 0.6525 resistance zone. There was a close above the 0.6555 resistance and the 50-hour simple moving average. Finally, the pair tested the 0.6585 zone. A high is formed at 0.6585 and the pair is now consolidating above 23.6% Fib retracement level of the upward move from the 0.6465 swing low to the 0.6585 high.
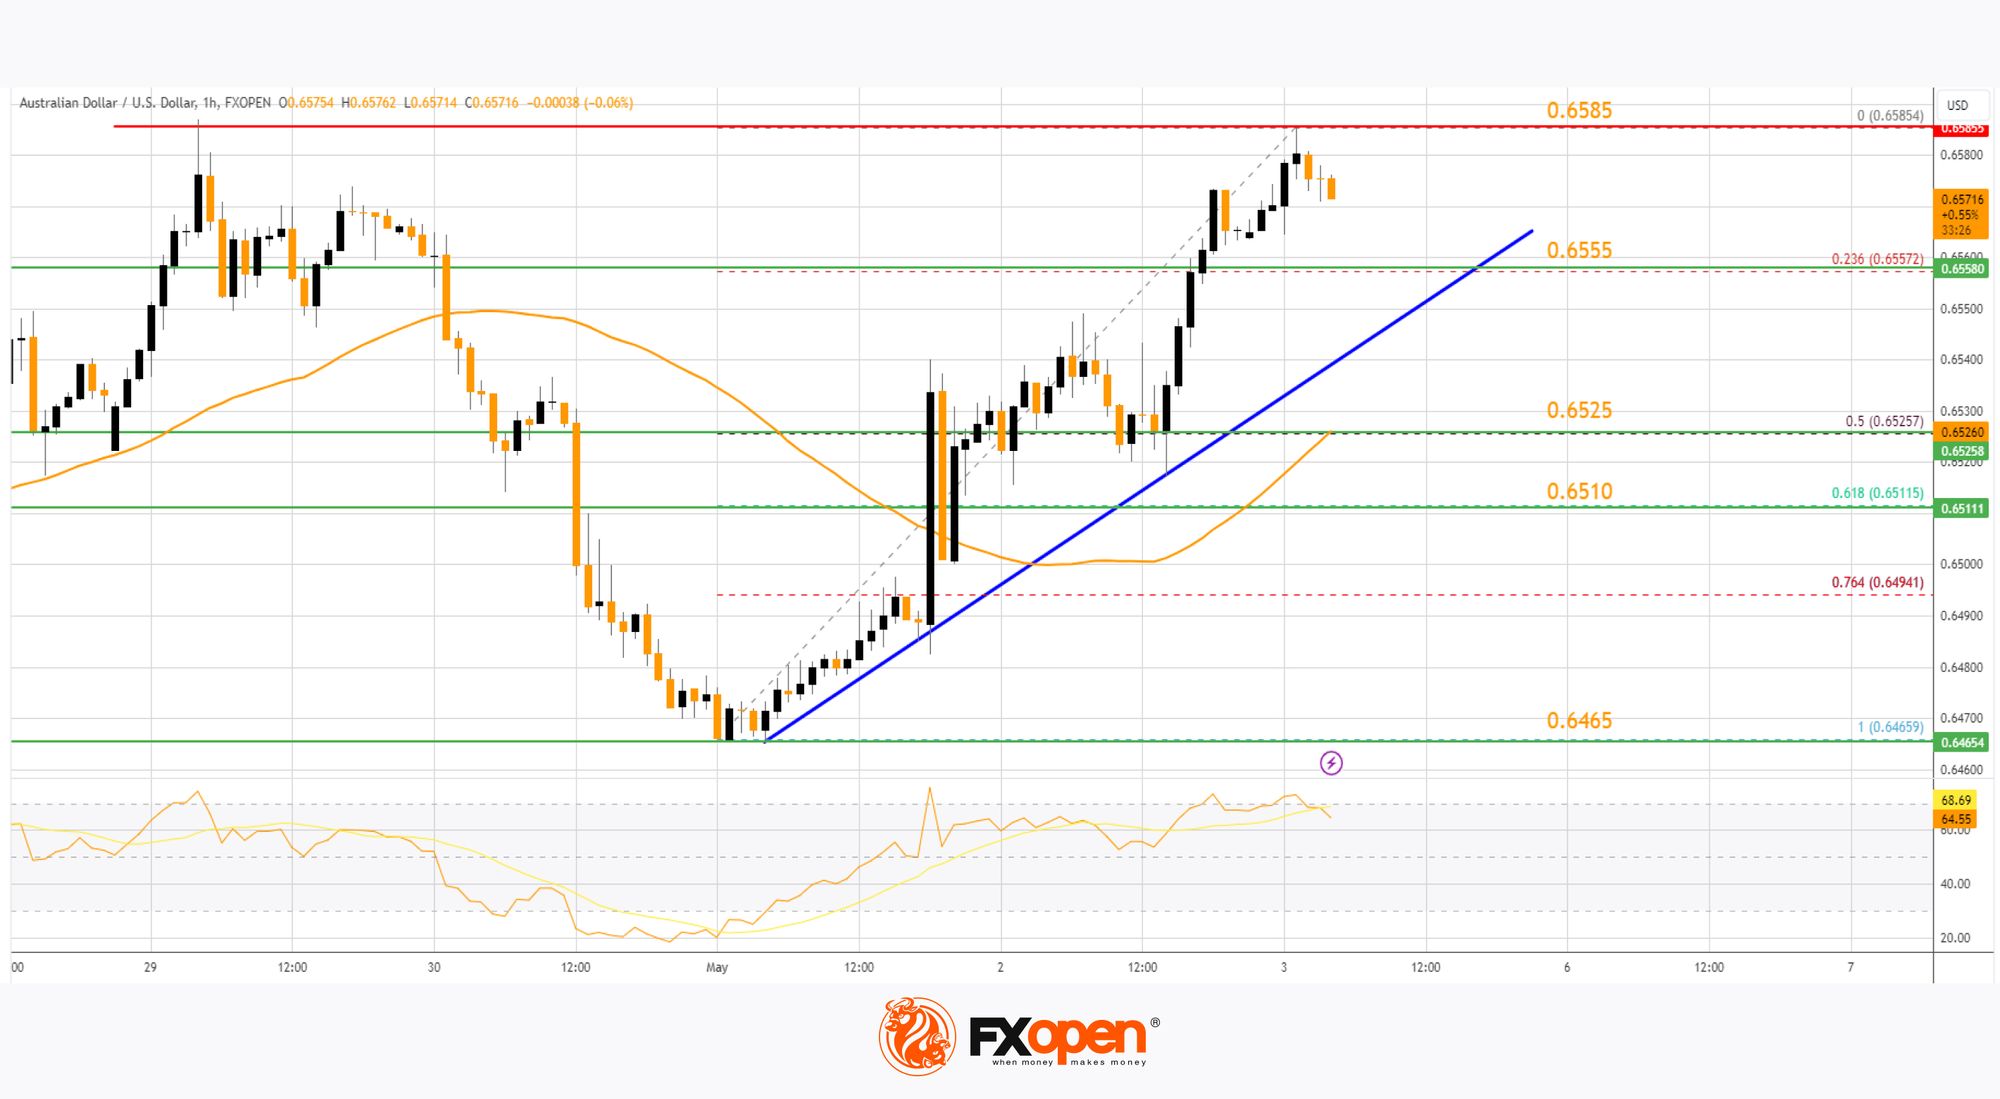
On the upside, the AUD/USD chart indicates that the pair is now facing resistance near 0.6585. The first major resistance might be 0.6620. An upside break above the 0.6620 resistance might send the pair further higher.
The next major resistance is near the 0.6665 level. Any more gains could clear the path for a move toward the 0.6720 resistance zone.
If not, the pair might correct lower. Immediate support is near a connecting bullish trend line at 0.6555. The next support could be 0.6525 or the 50% Fib retracement level of the upward move from the 0.6465 swing low to the 0.6585 high.
If there is a downside break below the 0.6525 support, the pair could extend its decline toward the 0.6510 zone. Any more losses might signal a move toward 0.6465.
NZD/USD Technical Analysis
On the hourly chart of NZD/USD on FXOpen, the pair also followed AUD/USD. The New Zealand Dollar formed a base above the 0.5875 level and started a decent increase against the US Dollar.
The pair climbed above the 0.5925 resistance and the 50-hour simple moving average. The pair even spiked above 0.5940. A high was formed near 0.5978 and the pair is now consolidating gains. The NZD/USD chart suggests that the RSI is correcting lower toward 60.
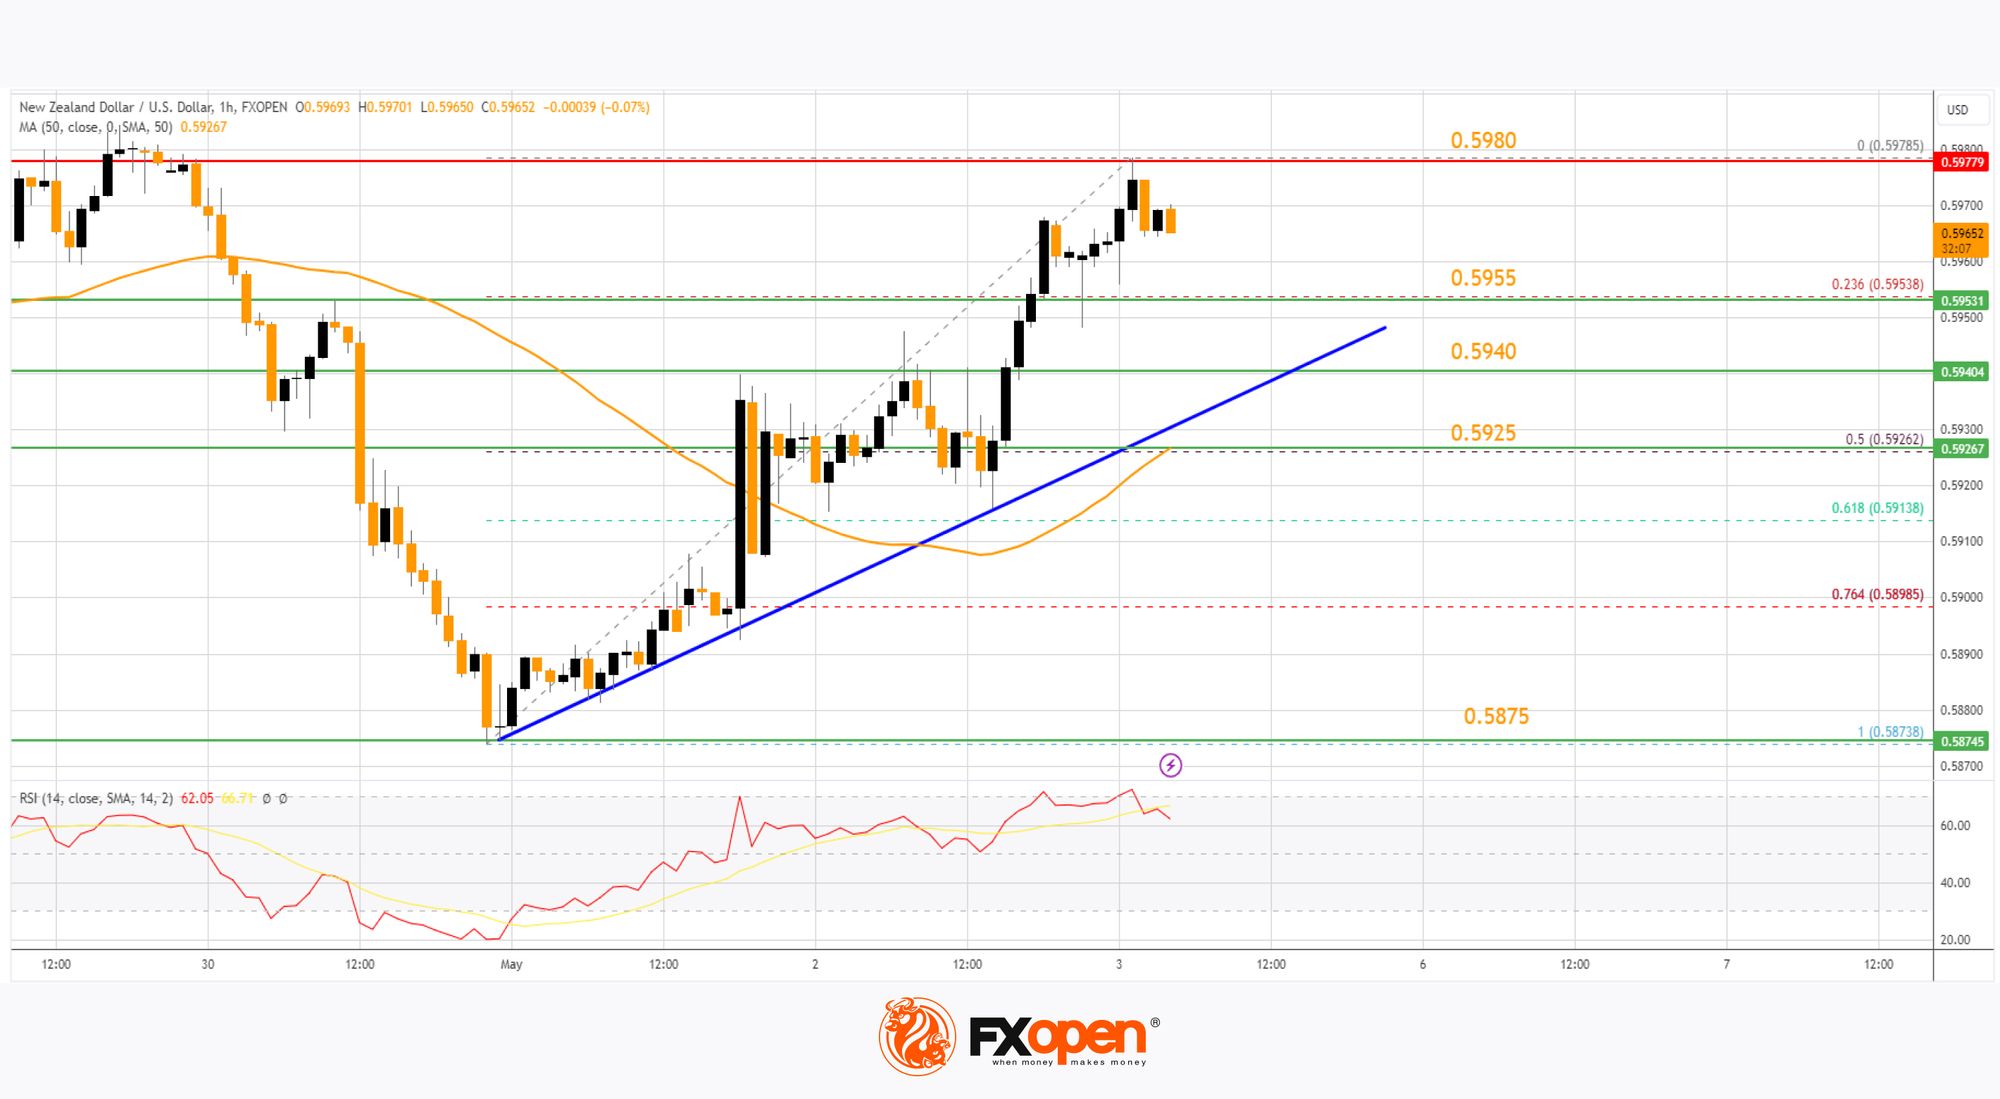
On the upside, the pair is facing resistance near the 0.5980 zone. The next major resistance is near the 0.6000 level. A clear move above the 0.6000 level might even push the pair toward the 0.6070 level.
Any more gains might clear the path for a move toward the 0.6120 resistance zone in the coming days. On the downside, there is a support forming near 0.5955 or the 23.6% Fib retracement level of the upward move from the 0.5873 swing low to the 0.5978 high.
There is also a bullish trend line forming with support at 0.5940. The next major support is 0.5925 or the 50% Fib retracement level of the upward move from the 0.5873 swing low to the 0.5978 high.
If there is a downside break below the 0.5925 support, the pair might slide toward 0.5875. Any more losses could lead NZD/USD in a bearish zone to 0.5820.
Trade over 50 forex markets 24 hours a day with FXOpen. Take advantage of low commissions, deep liquidity, and spreads from 0.0 pips. Open your FXOpen account now or learn more about trading forex with FXOpen.
This article represents the opinion of the Companies operating under the FXOpen brand only. It is not to be construed as an offer, solicitation, or recommendation with respect to products and services provided by the Companies operating under the FXOpen brand, nor is it to be considered financial advice.
Latest from Forex Analysis
Latest articles

Weekly Market Wrap With Gary Thomson: S&P500, US Dollar, Gold Price, PEP Stocks
Get he latest scoop on the week's hottest headlines, all in one convenient video. Join Gary Thomson, the COO of FXOpen UK, as he breaks down the most significant news reports and shares his expert insights. Read the latest news

The Price of Silver Has Reached Its Highest Level in Over Three Years
As indicated by the XAG/USD chart today, the intraday price of silver reached $29.84 per ounce yesterday, while the previous yearly high on 12 April was $29.79. The last time this price was seen was in February

What Is the Wolfe Wave, and How Can You Trade It?
The Wolfe Waves is a powerful chart pattern recognised for analysing potential price reversals. Named after Bill Wolfe, who developed this formation through extensive trading practice, Wolfe Waves provide traders with a structured approach to anticipate market movements. In this