


FXOpen

Gold price is forming a new support base above the $1,900 level. Crude oil price is currently rising and eyeing an upside break above the $43.30 resistance.
Important Takeaways for Gold and Oil
- Gold price declined below the $1,950 level, but it found support above $1,900 against the US Dollar.
- There is a key bearish trend line forming with resistance near $1,942 on the hourly chart of gold.
- Crude oil price is currently trading in a positive zone above the $42.40 support zone.
- There is a major declining channel forming with resistance near $43.30 on the hourly chart of XTI/USD.
Gold Price Technical Analysis
Gold price started a bearish wave below the $2,000 level against the US Dollar. The price broke the $1,950 support level to move into a short-term bearish zone.
The price even traded below the $1,920 level, but it found support above $1,900. The recent low is formed near $1,909 on FXOpen and the price is currently correcting higher.
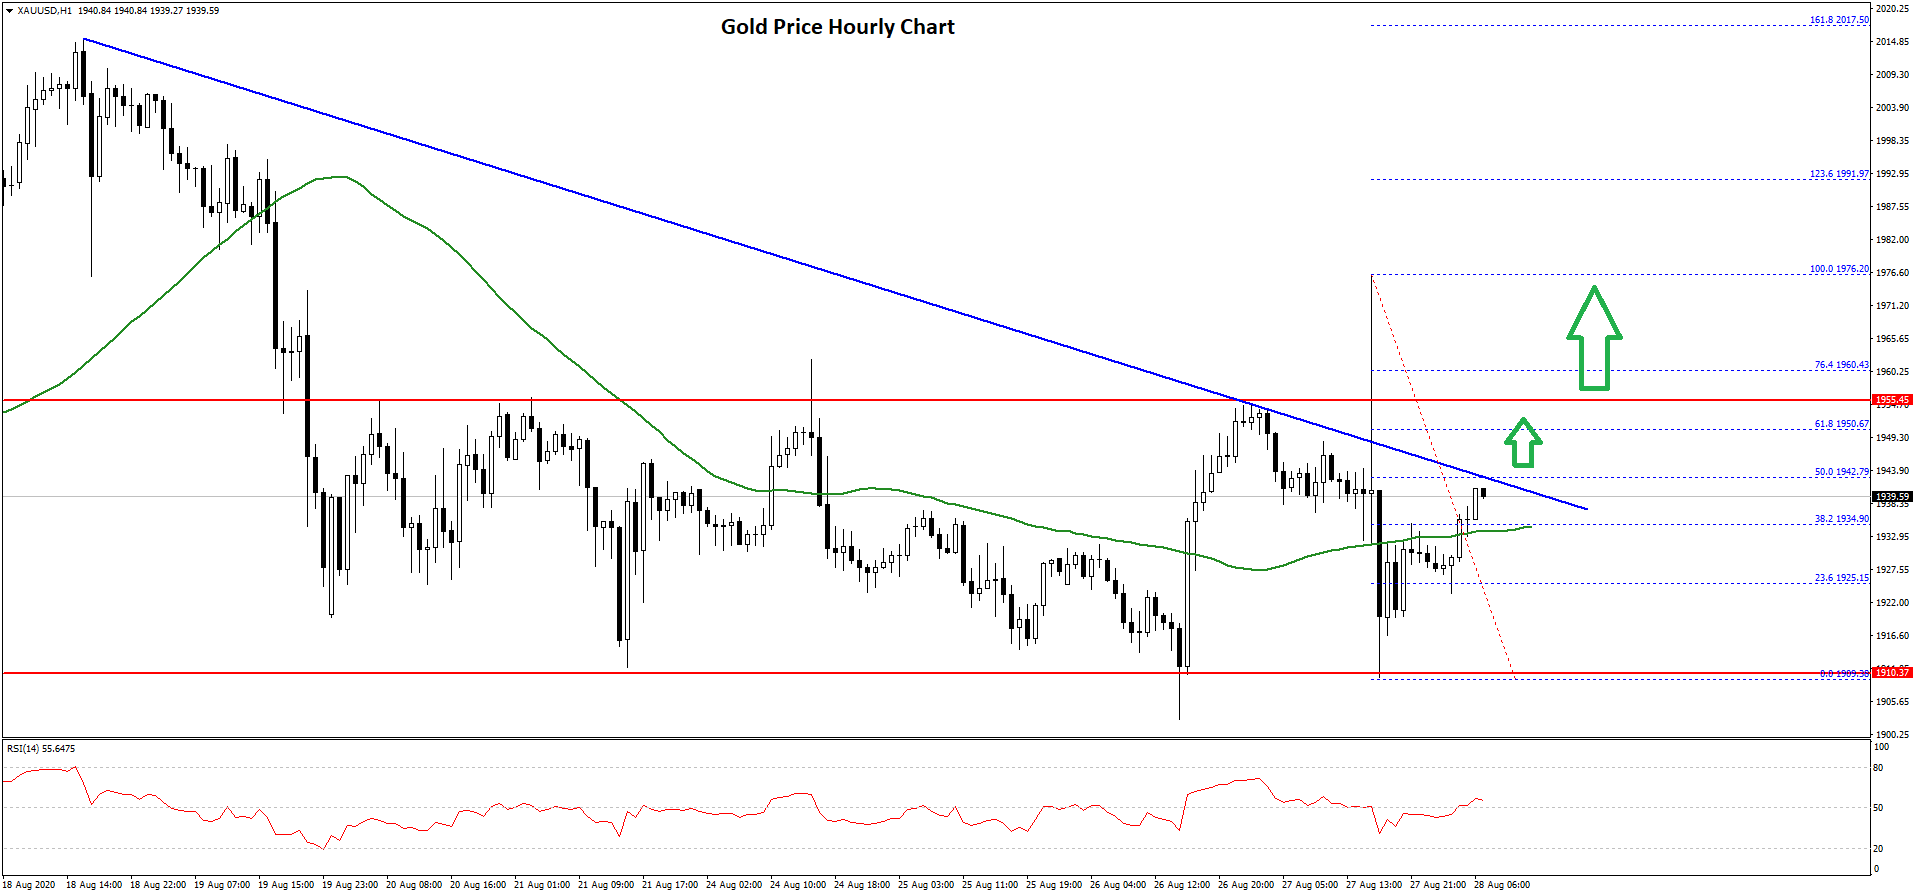
It broke the $1,920 and $1,930 resistance levels. There was also a break above the 38.2% Fib retracement level of the recent decline from the $1,976 high to $1,909 low, and the 50 hourly simple moving average.
On the upside, the price is facing a major resistance near $1,940 and $1,950. There is also a key bearish trend line forming with resistance near $1,942 on the hourly chart of gold.
The trend line coincides with the 50% Fib retracement level of the recent decline from the $1,976 high to $1,909 low. If there is a clear break above the $1,940 and $1,950 resistance levels, the price could continue to rise.
The next major resistance is near $1,975, followed by $1,980. Conversely, the price might fail to surpass the $1,950 resistance. An initial support on the downside is near the $1,935 level and the 50 hourly SMA.
The next major support is near the $1,920 level, below which the price might struggle to stay above the $1,900 support zone in the coming sessions.
Oil Price Technical Analysis
Crude oil price started a fresh increase above the $41.20 and $41.50 resistance levels against the US Dollar. The price even broke the $42.40 resistance zone to move into a positive zone.
It traded as high as $43.84 and recently declined sharply below $43.00. There was also a break below the $42.80 level and the 50 hourly simple moving average. It traded as low as $42.46 and currently correcting higher.
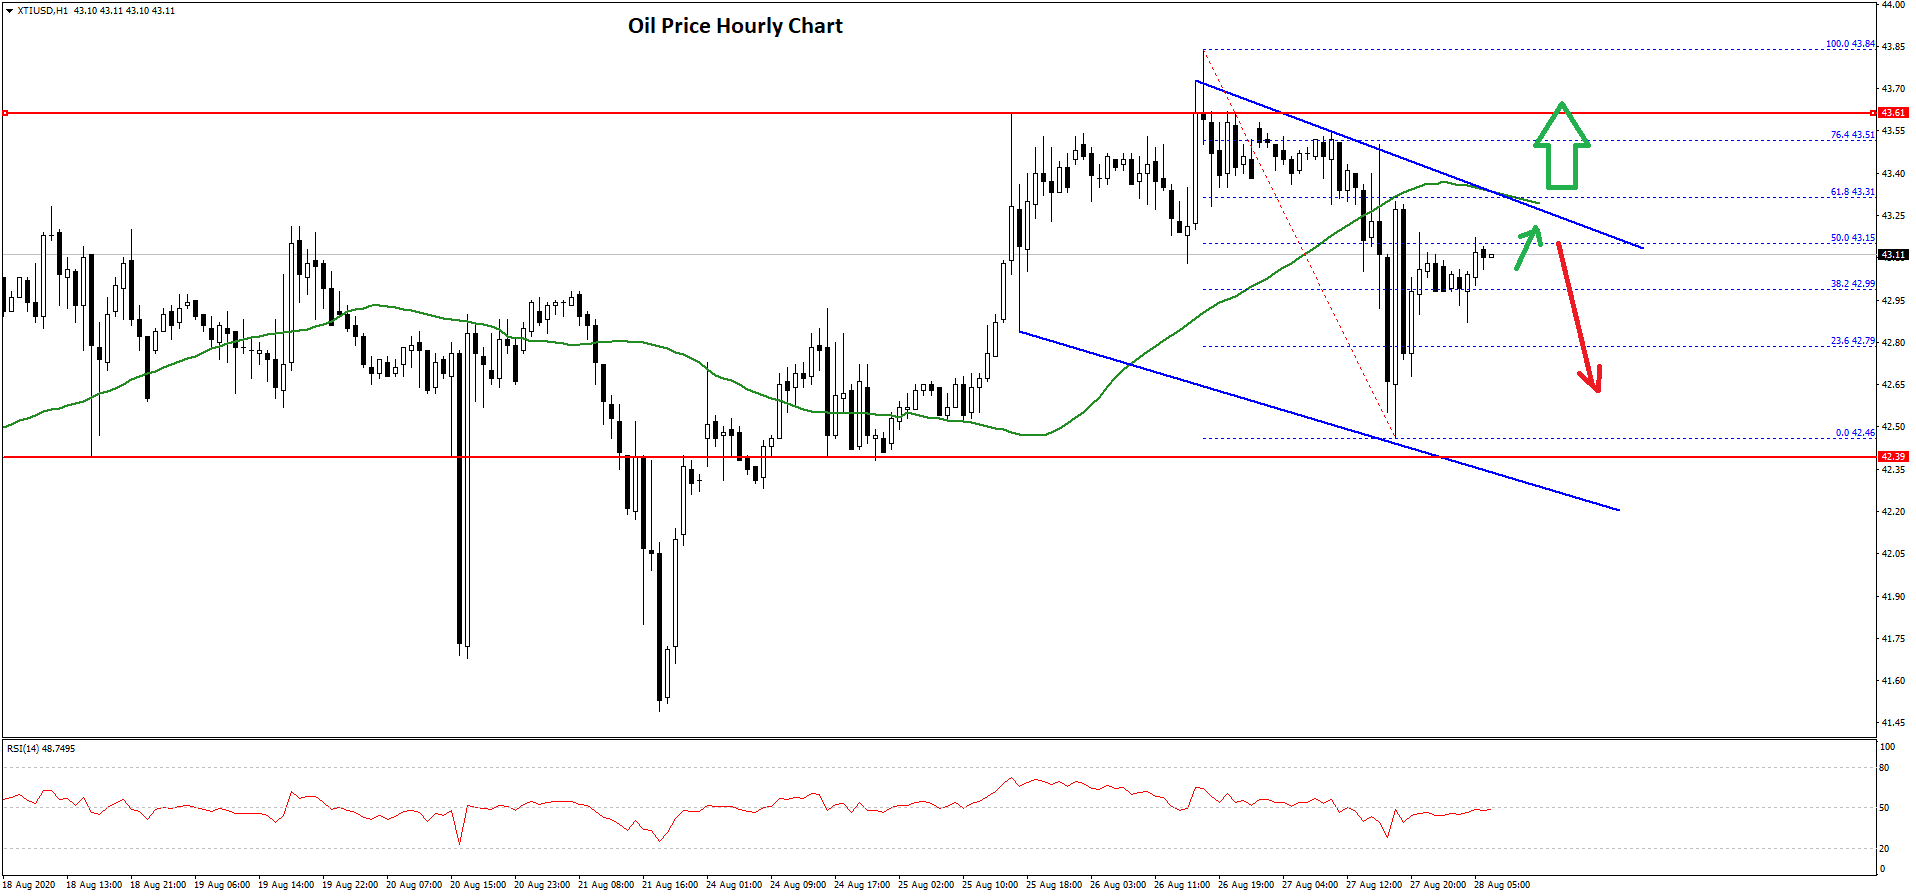
There was a break above the $42.80 level, and the 38.2% Fib retracement level of the recent decline from the $43.84 high to $42.46 low. The price is now facing hurdles near the $43.15 and $43.20 levels.
There is also a major declining channel forming with resistance near $43.30 on the hourly chart of XTI/USD. The channel resistance is close to the 50% Fib retracement level of the recent decline from the $43.84 high to $42.46 low.
Therefore, a clear break above the trend line resistance is needed for a decent increase above the $43.50 level. Conversely, oil price might start a fresh decline below the $43.00 level. The main support on the downside is near $42.40, below which the price might even break $42.00.
Trade over 50 forex markets 24 hours a day with FXOpen. Take advantage of low commissions, deep liquidity, and spreads from 0.0 pips. Open your FXOpen account now or learn more about trading forex with FXOpen.
This article represents the opinion of the Companies operating under the FXOpen brand only. It is not to be construed as an offer, solicitation, or recommendation with respect to products and services provided by the Companies operating under the FXOpen brand, nor is it to be considered financial advice.
Latest from Forex Analysis
Latest articles

Anchored VWAP and How You Can Use It in Forex Trading
In the world of forex trading, understanding the nuanced tools at your disposal can significantly enhance decision-making processes. One such sophisticated tool is the Anchored Volume-Weighted Average Price (Anchored VWAP), which refines the standard VWAP by allowing traders to set

META Share Price Collapses after Publication of Quarterly Report
Just yesterday, META's stock price closed at USD 493.50, up approximately 40% since the start of 2024 and up nearly 300% since the start of 2023.
However, following the release of Meta's quarterly report, its shares plummeted to USD

USD/JPY Analysis: The Rate Exceeds The Level of 155 Yen Per US Dollar
Today, the price of USD/JPY once again renewed its 34-year high, exceeding the level of 155 yen per dollar, which put pressure on the current authorities.
According to Reuters, officials are trying to maintain calm in the market.
"We