


FXOpen

Gold price struggled to continue higher above $1,745 and it is currently declining. Similarly, crude oil price is facing an increase in selling pressure below the $36.50 support.
Important Takeaways for Gold and Oil
- Gold price is showing a lot of bearish signs and it is trading below $1,730 against the US Dollar.
- There was a break below a key bullish trend line with support near $1,726 on the hourly chart of gold.
- Crude oil price declined sharply after forming a major top near the $40.00 level.
- There was a break below an important bullish trend line with support near $37.85 on the hourly chart of XTI/USD.
Gold Price Technical Analysis
Gold price struggled to gain strength above the $1,745 level and started a fresh decline against the US Dollar. The price traded as high as $1,744 on FXOpen and recently declined below the $1,735 support level.
There was a break below the $1,730 support and the 50 hourly simple moving average. Besides, the price traded below the 50% Fib retracement level of the upward move from the $1,708 low to $1,744 high.
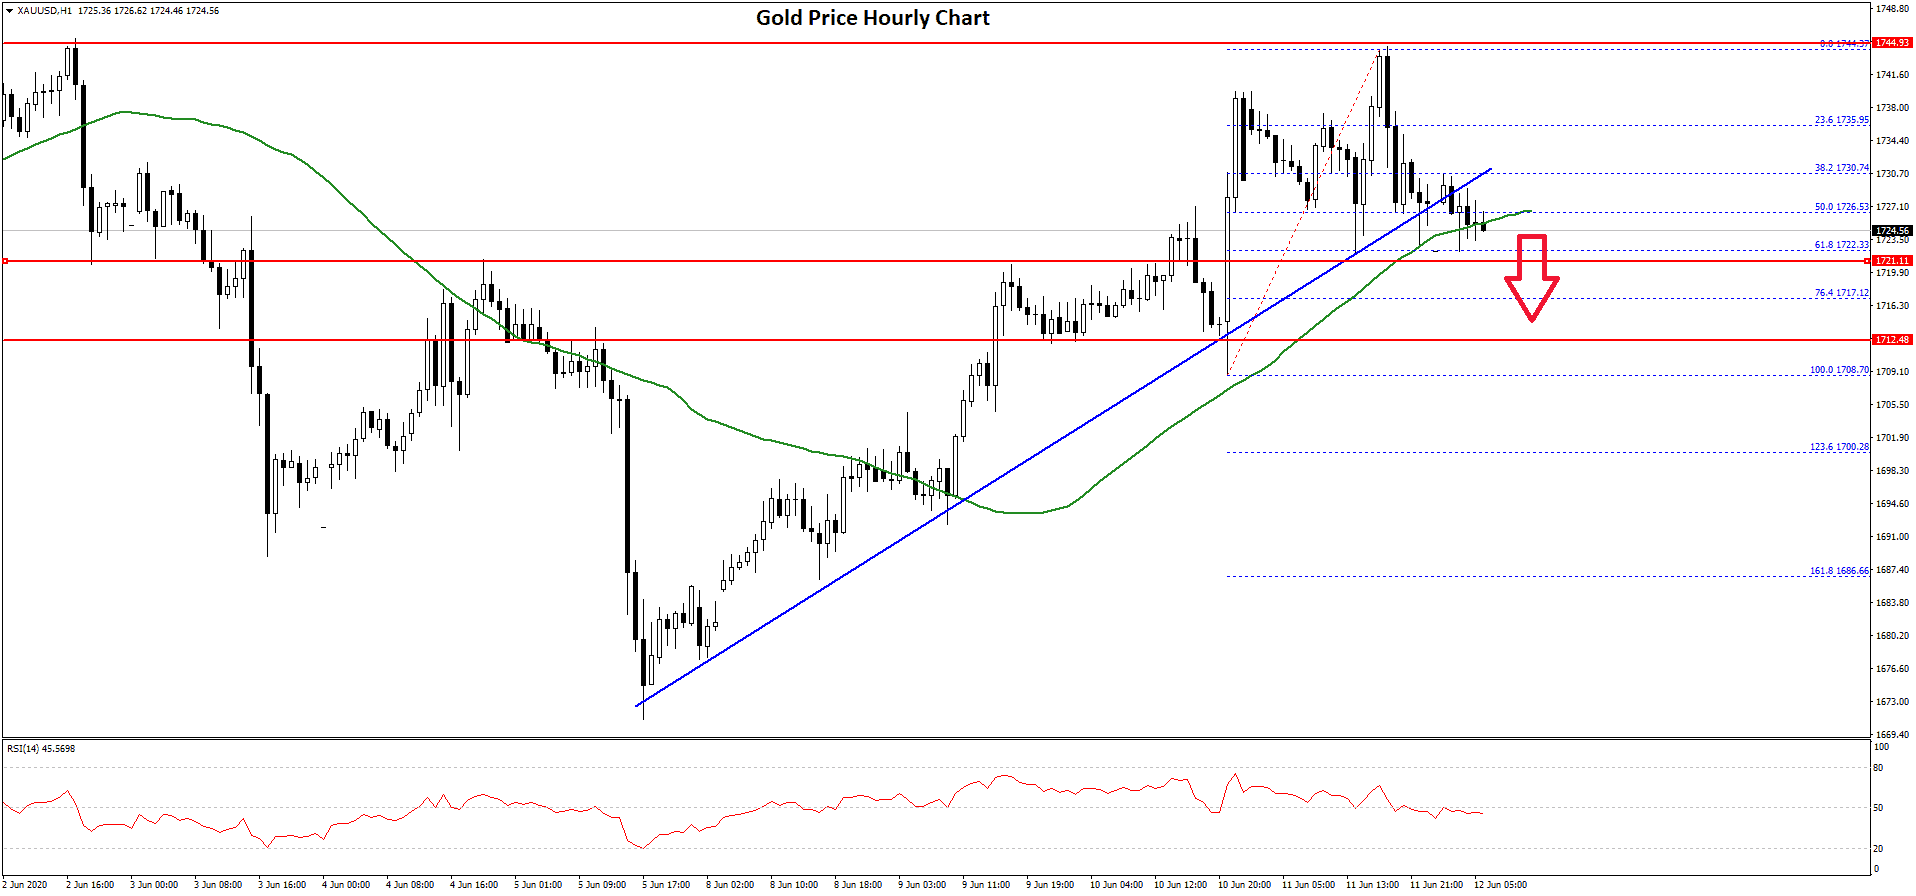
More importantly, there was a break below a key bullish trend line with support near $1,726 on the hourly chart of gold. The price is now testing the $1,724 and $1,722 support levels.
The 61.8% Fib retracement level of the upward move from the $1,708 low to $1,744 high is also acting as a decent support. If there is a downside break below the $1,722 and $1,720 levels, there are chances of more losses.
The next key support is near the $1,708 low, below which the price might continue to move down towards the $1,700 support zone.
On the upside, an initial resistance is near the $1,730 level. A successful break above the $1,730 and $1,735 levels is needed for a fresh increase towards $1,745 or even $1,750.
Oil Price Technical Analysis
Crude oil price started a major decline from well above the $40.00 level against the US Dollar. The price broke many key supports near $38.00 and $37.50 to move into a bearish zone.
The decline was such that the price settled below the $37.50 level and the 50 hourly simple moving average. Moreover, there was a break below an important bullish trend line with support near $37.85 on the hourly chart of XTI/USD.
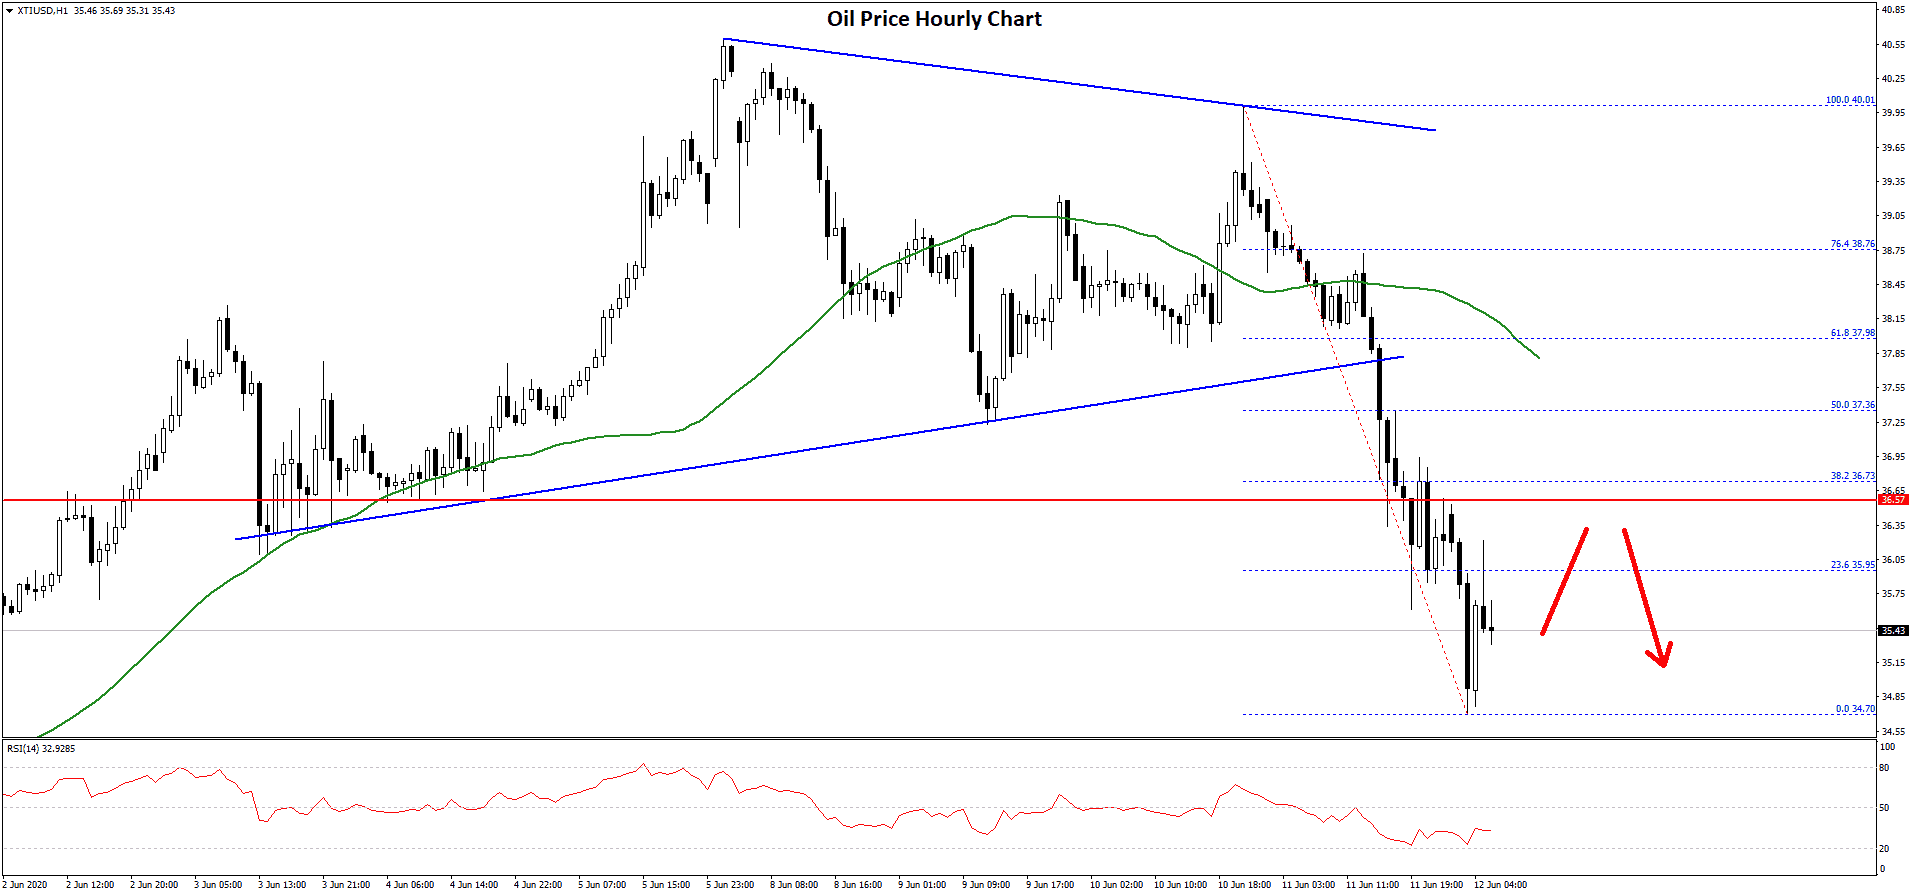
The price even broke the $35.50 support and spiked below the $35.00 level. A low is formed near the $34.70 level and the price is currently correcting higher.
It is testing the 23.6% Fib retracement level of the recent decline from the $40.01 high to $34.70 low. On the upside, there is a major resistance forming near the $36.50 and $36.75 levels.
The next major hurdle is near the $37.40 level or the 50% Fib retracement level of the recent decline from the $40.01 high to $34.70 low. To move into a positive zone, the price must break the $37.40 resistance and settle above the 50 hourly simple moving average.
Conversely, the price might continue to move down below the $35.50 and $35.00 support. The next key support is seen near the $34.20 level, below which there is a risk of a larger decline.
Trade over 50 forex markets 24 hours a day with FXOpen. Take advantage of low commissions, deep liquidity, and spreads from 0.0 pips. Open your FXOpen account now or learn more about trading forex with FXOpen.
This article represents the opinion of the Companies operating under the FXOpen brand only. It is not to be construed as an offer, solicitation, or recommendation with respect to products and services provided by the Companies operating under the FXOpen brand, nor is it to be considered financial advice.
Latest from Forex Analysis
Latest articles

Anchored VWAP and How You Can Use It in Forex Trading
In the world of forex trading, understanding the nuanced tools at your disposal can significantly enhance decision-making processes. One such sophisticated tool is the Anchored Volume-Weighted Average Price (Anchored VWAP), which refines the standard VWAP by allowing traders to set

META Share Price Collapses after Publication of Quarterly Report
Just yesterday, META's stock price closed at USD 493.50, up approximately 40% since the start of 2024 and up nearly 300% since the start of 2023.
However, following the release of Meta's quarterly report, its shares plummeted to USD

USD/JPY Analysis: The Rate Exceeds The Level of 155 Yen Per US Dollar
Today, the price of USD/JPY once again renewed its 34-year high, exceeding the level of 155 yen per dollar, which put pressure on the current authorities.
According to Reuters, officials are trying to maintain calm in the market.
"We