


FXOpen

GBP/USD struggled to continue above the 1.2650 resistance and declined below 1.2550. USD/CAD is showing positive signs and it could continue to rise towards 1.3650.
Important Takeaways for GBP/USD and USD/CAD
- The British Pound is following a bearish path from well above the 1.2620 level.
- There is a major bearish trend line forming with resistance near 1.2580 on the hourly chart of GBP/USD.
- USD/CAD started a decent increase from the 1.3500 support area.
- There was a break above a crucial bearish trend line with resistance near 1.3550 on the hourly chart.
GBP/USD Technical Analysis
This past week, the British Pound made a couple of attempts to gain strength above 1.2650 against the US Dollar. However, the GBP/USD pair failed to continue higher and it started a fresh decline below 1.2600.
There was a break below a few key supports near the 1.2580 and 1.2550 levels. Moreover, there was a close below the 1.2550 level and the 50 hourly simple moving average.
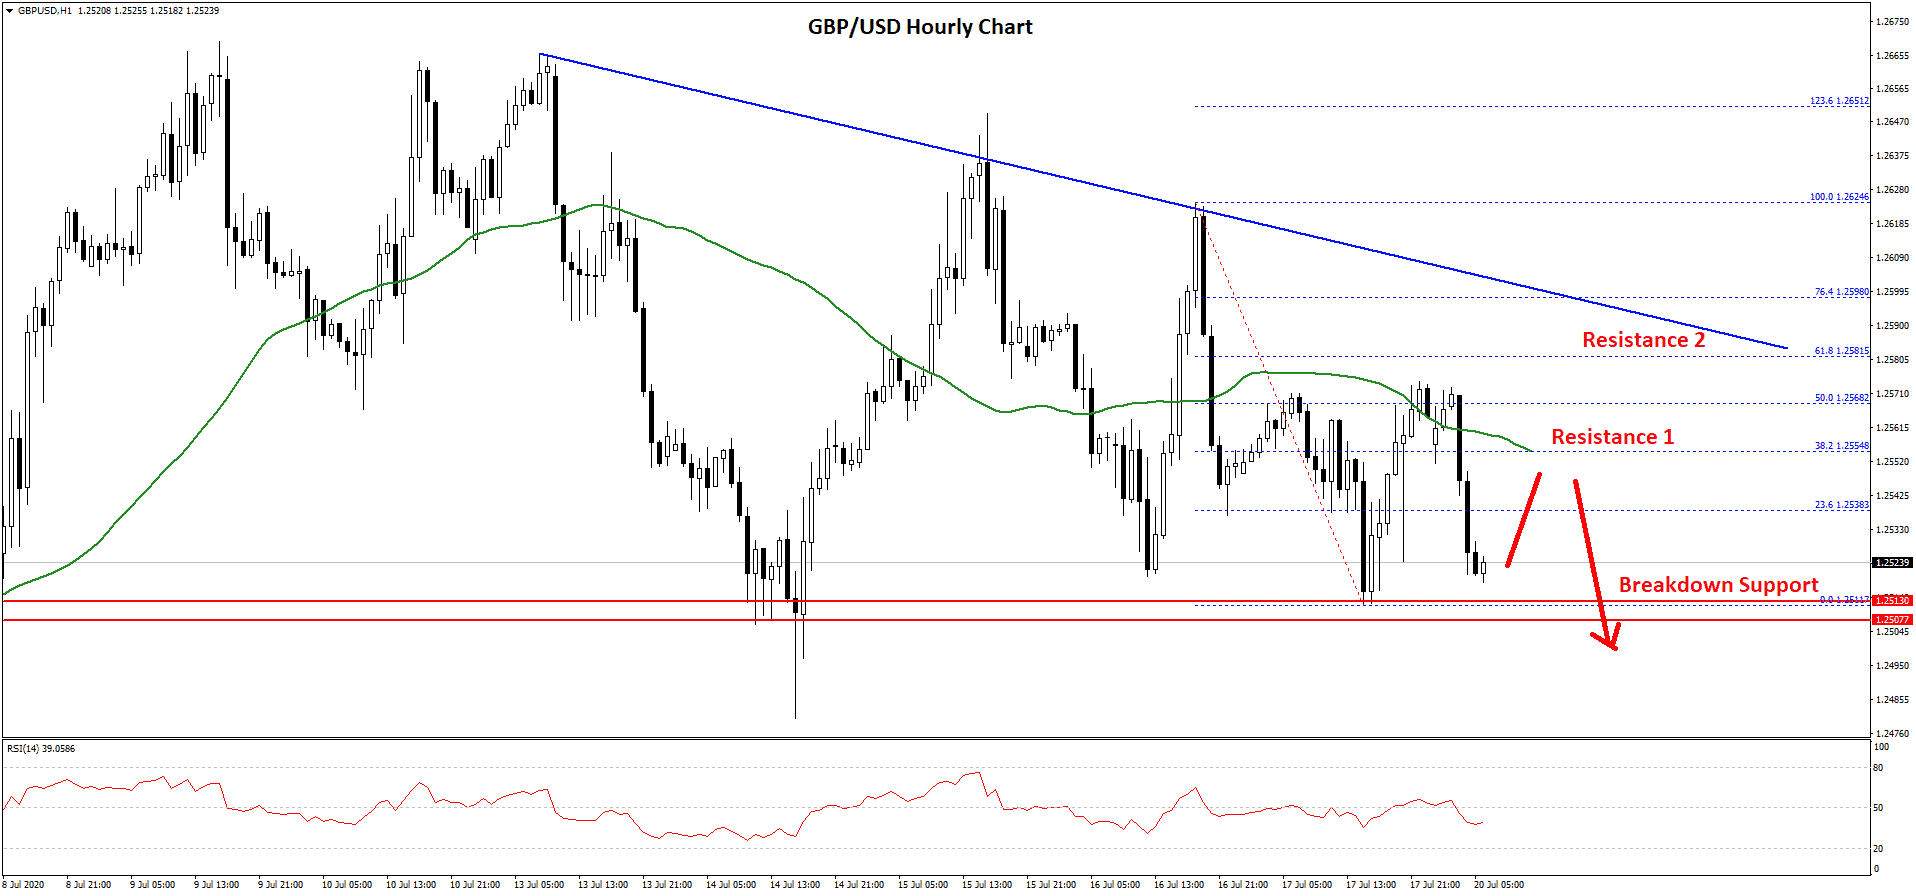
The pair traded close to the 1.2500 area and a low was formed at 1.2511 on FXOpen. Recently, there was a minor upside correction above the 1.2550 level and the 50 hourly simple moving average.
However, the pair struggled to clear the 50% Fib retracement level of the downward move from the 1.2624 high to 1.2511 low. There is also a major bearish trend line forming with resistance near 1.2580 on the hourly chart of GBP/USD.
The trend line is close to the 61.8% Fib retracement level of the downward move from the 1.2624 high to 1.2511 low. Clearly, the pair is facing an increase in selling pressure below 1.2550 and 1.2580.
On the downside, the 1.2510 and 1.2510 levels are important supports. A successful close below the 1.2500 level may perhaps open the doors for a sharp decline. The next major support could be 1.2450, below which the pair might retest 1.2420. On the upside, the pair must gain momentum above 1.2580 for a fresh increase in the near term.
USD/CAD Technical Analysis
The US Dollar formed a strong support base near the 1.3500 levels against the Canadian Dollar. As a result, the USD/CAD pair started a decent upward move above the 1.3550 resistance level.
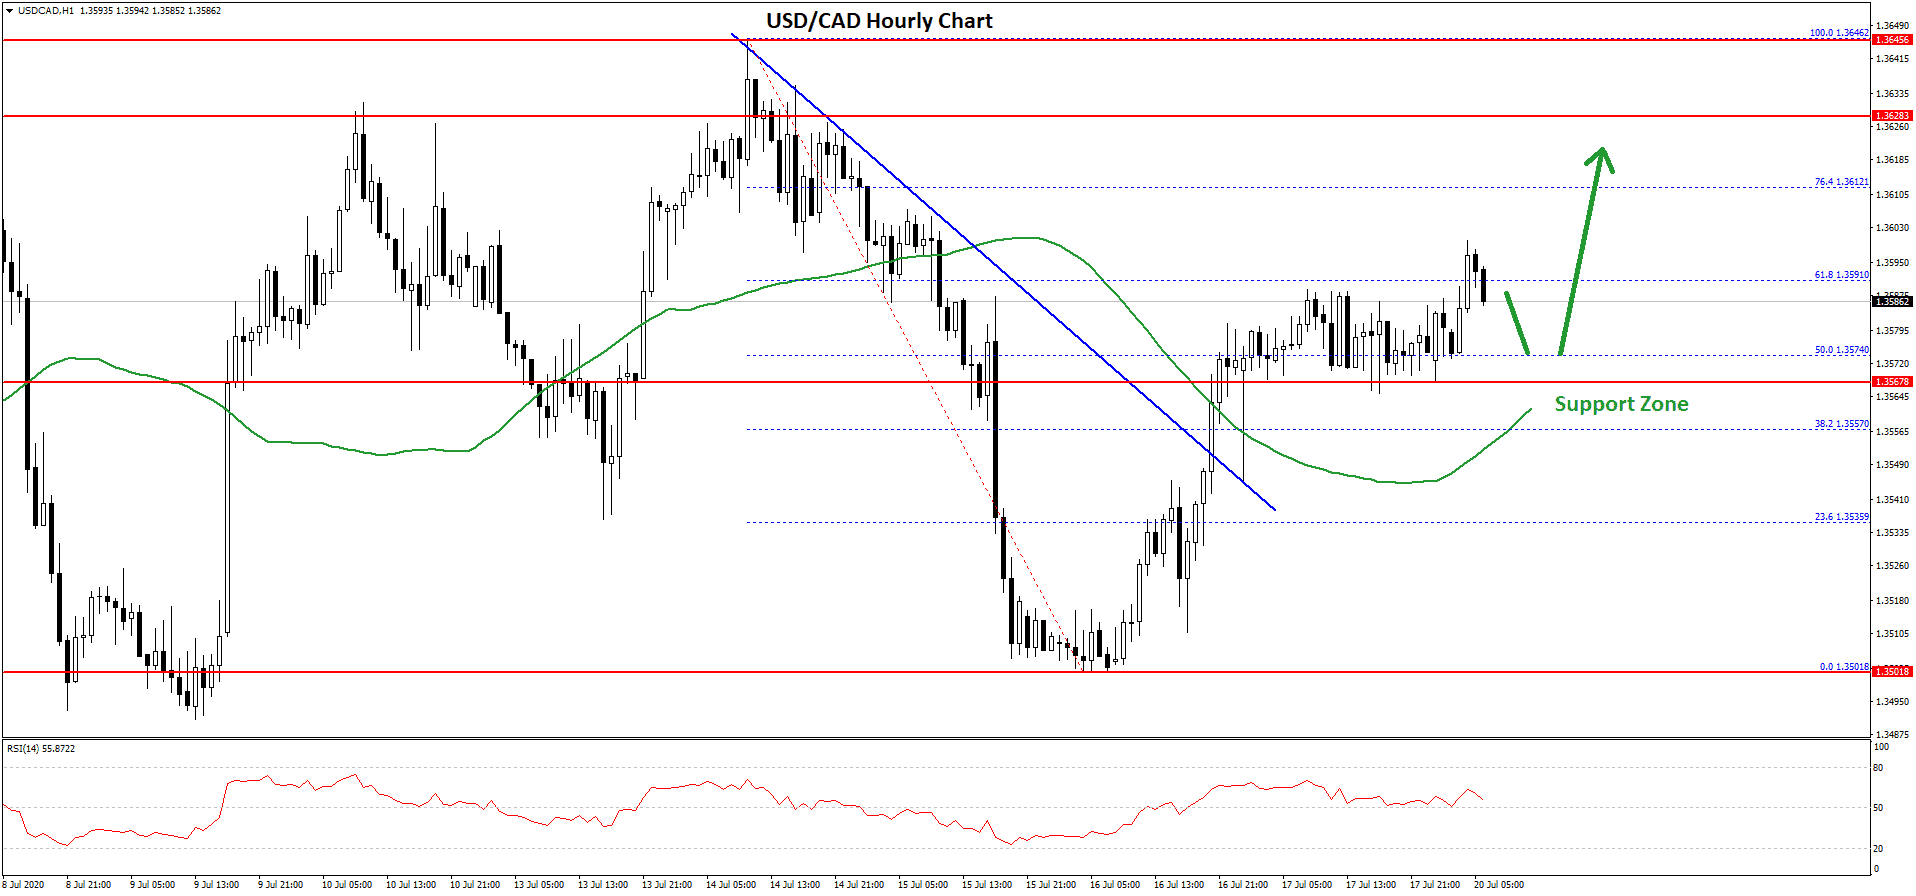
There was also a break above a crucial bearish trend line with resistance near 1.3550 on the hourly chart. The pair settled nicely above the 1.3565 level and 50 hourly simple moving average. Moreover, there was a break above the 50% Fib retracement level of the downward move from the 1.3646 high to 1.3501 low.
At the moment, the pair is facing hurdles near the 1.3590 and 1.3600 levels. The next resistance is seen near the 1.3612 level since it is close to the 76.4% Fib retracement level of the downward move from the 1.3646 high to 1.3501 low.
Any further gains could lead the pair towards the 1.3650 resistance in the coming sessions. Conversely, there is a risk of a downside break below 1.3565.
A clear break below the 1.3565 and 1.3550 support levels may perhaps start a fresh decline. Overall, as long as USD/CAD is trading above 1.3550, it is likely to continue higher towards the 1.3650 and 1.3660 levels in the coming sessions.
Trade over 50 forex markets 24 hours a day with FXOpen. Take advantage of low commissions, deep liquidity, and spreads from 0.0 pips. Open your FXOpen account now or learn more about trading forex with FXOpen.
This article represents the opinion of the Companies operating under the FXOpen brand only. It is not to be construed as an offer, solicitation, or recommendation with respect to products and services provided by the Companies operating under the FXOpen brand, nor is it to be considered financial advice.
Latest from Forex Analysis
Latest articles

Anchored VWAP and How You Can Use It in Forex Trading
In the world of forex trading, understanding the nuanced tools at your disposal can significantly enhance decision-making processes. One such sophisticated tool is the Anchored Volume-Weighted Average Price (Anchored VWAP), which refines the standard VWAP by allowing traders to set

META Share Price Collapses after Publication of Quarterly Report
Just yesterday, META's stock price closed at USD 493.50, up approximately 40% since the start of 2024 and up nearly 300% since the start of 2023.
However, following the release of Meta's quarterly report, its shares plummeted to USD

USD/JPY Analysis: The Rate Exceeds The Level of 155 Yen Per US Dollar
Today, the price of USD/JPY once again renewed its 34-year high, exceeding the level of 155 yen per dollar, which put pressure on the current authorities.
According to Reuters, officials are trying to maintain calm in the market.
"We