


FXOpen

GBP/USD started a fresh decline after testing the 1.3625 zone. USD/CAD is rising and it is showing a lot of positive signs above the 1.2800 level.
Important Takeaways for GBP/USD and USD/CAD
- The British Pound started a fresh downside correction from the 1.3624 high.
- There was a break below a major bullish trend line with support near 1.3530 on the hourly chart of GBP/USD.
- USD/CAD started a strong increase from the 1.2700 support zone and climbed above 1.2800.
- There was a break above a key bearish trend line with resistance near 1.2740 on the hourly chart.
GBP/USD Technical Analysis
This past week, the British Pound gained momentum above the 1.3500 resistance level against the US Dollar. The GBP/USD pair broke the 1.3550 and 1.3560 resistance levels to move into a positive zone.
The pair even broke the 1.3600 resistance and traded as high as 1.3624 on FXOpen. This week, it opened with a gap lower and traded below the 1.3520 support zone. There was a close below the 1.3500 level and the 50 hourly simple moving average.
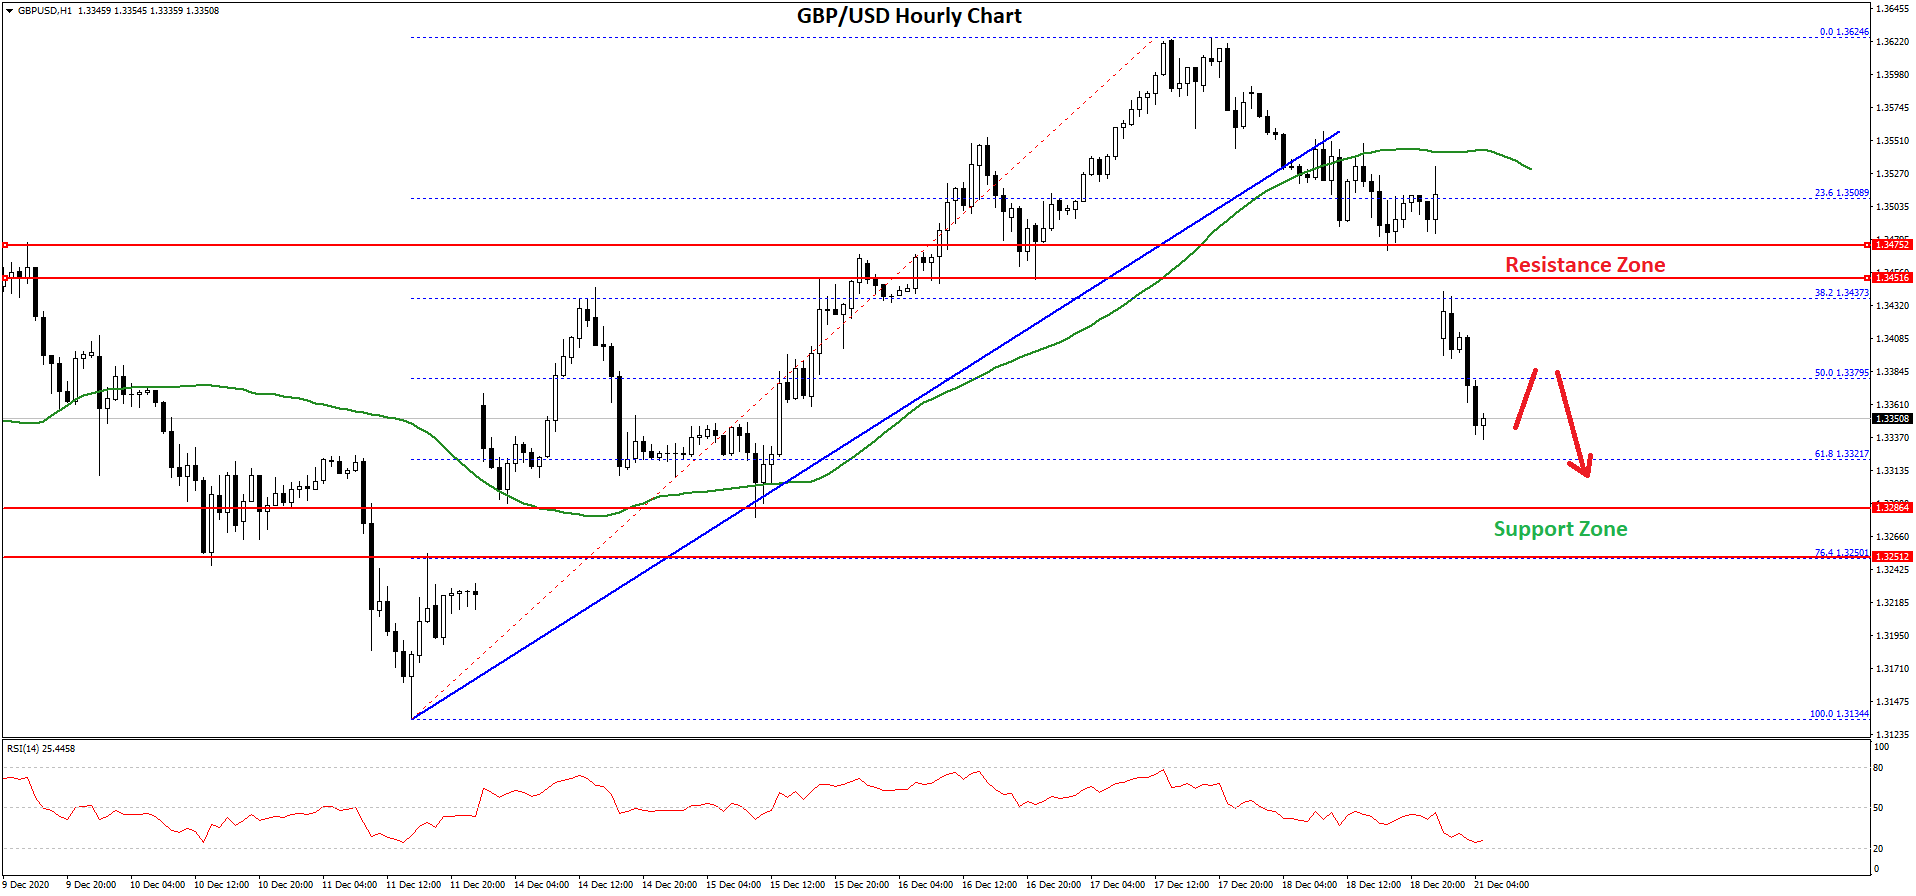
Moreover, there was a break below a major bullish trend line with support near 1.3530 on the hourly chart of GBP/USD. The pair even traded below the 50% Fib retracement level of the upward move from the 1.3134 swing low to 1.3624 high.
An immediate support is near the 1.3320 level. It is close to the 61.8% Fib retracement level of the upward move from the 1.3134 swing low to 1.3624 high.
The next major support is near the 1.3280 level. If there are more downsides, the pair could dive towards the 1.3200 support zone in the near term. On the upside, an initial resistance level is near the 1.3400 level.
The main resistance is now forming near the 1.3500 zone and 50 hourly simple moving average. A close above 1.3500 could open the doors for a push towards the 1.3624 high.
USD/CAD Technical Analysis
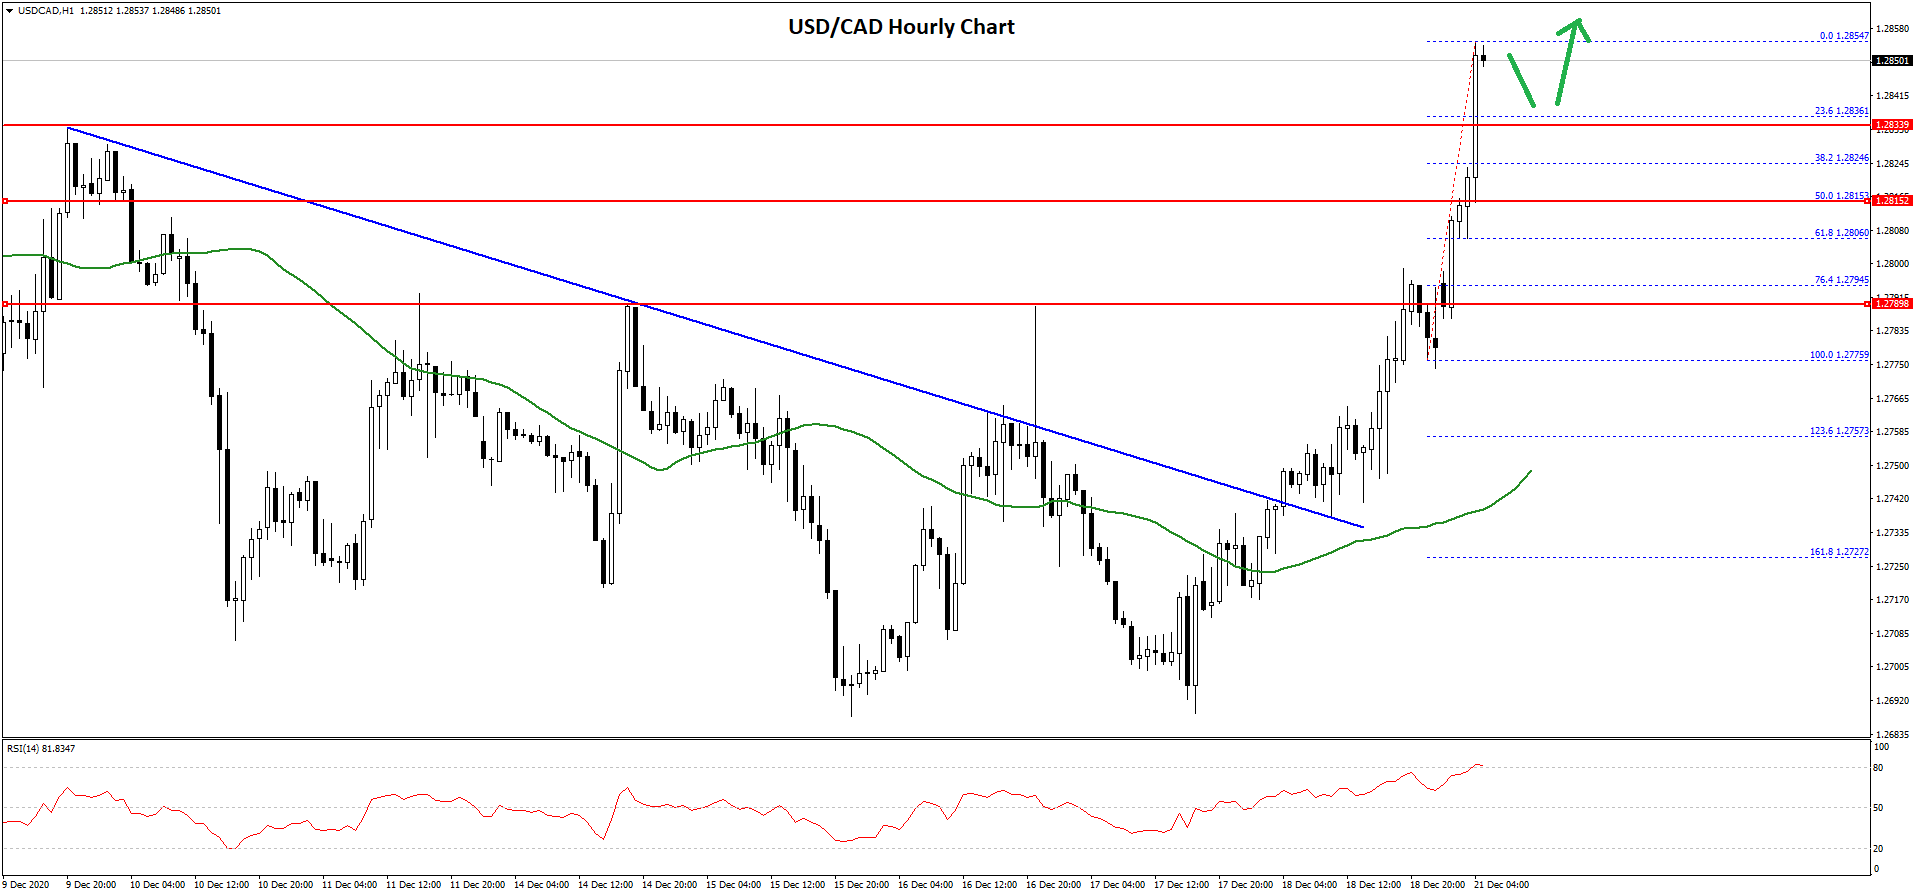
The US Dollar formed a strong support base near 1.2700 and started a fresh increase against the Canadian Dollar. The USD/CAD pair broke many important hurdles near 1.2750 to move into a positive zone.
There was also a break above a key bearish trend line with resistance near 1.2740 on the hourly chart. The pair settled nicely above the 1.2800 level and the 50 hourly simple moving average.
 gbp
gbp
It even spiked above 1.2850 and traded as high as 1.2854. It is currently consolidating gains above the 1.2820 support level. An initial support is near the 1.2835 level. It is close to the 23.6% Fib retracement level of the recent wave from the 1.2775 swing low to 1.2854 high.
The main support is forming near the 1.2815 level. It is close to the 50% Fib retracement level of the recent wave from the 1.2775 swing low to 1.2854 high. Any more losses might call for a break below the 1.2800 support zone.
On the upside, the 1.2850 level is a key resistance. Therefore, a successful break and close above the 1.2850 resistance level could spark another strong upward move.
The next key resistance is near the 1.2885 level, above which the bulls are likely to target more upsides above the 1.2900 level.
Trade over 50 forex markets 24 hours a day with FXOpen. Take advantage of low commissions, deep liquidity, and spreads from 0.0 pips. Open your FXOpen account now or learn more about trading forex with FXOpen.
This article represents the opinion of the Companies operating under the FXOpen brand only. It is not to be construed as an offer, solicitation, or recommendation with respect to products and services provided by the Companies operating under the FXOpen brand, nor is it to be considered financial advice.
Latest from Forex Analysis
Latest articles

Anchored VWAP and How You Can Use It in Forex Trading
In the world of forex trading, understanding the nuanced tools at your disposal can significantly enhance decision-making processes. One such sophisticated tool is the Anchored Volume-Weighted Average Price (Anchored VWAP), which refines the standard VWAP by allowing traders to set

META Share Price Collapses after Publication of Quarterly Report
Just yesterday, META's stock price closed at USD 493.50, up approximately 40% since the start of 2024 and up nearly 300% since the start of 2023.
However, following the release of Meta's quarterly report, its shares plummeted to USD

USD/JPY Analysis: The Rate Exceeds The Level of 155 Yen Per US Dollar
Today, the price of USD/JPY once again renewed its 34-year high, exceeding the level of 155 yen per dollar, which put pressure on the current authorities.
According to Reuters, officials are trying to maintain calm in the market.
"We