


FXOpen
BTC/USD
From yesterday’s low at around $5780 the price of Bitcoin has increased by 14.76% measured to it’s highest point today which was at $6633. The price is currently being traded around those levels, slightly lower but is still in an upward trajectory.
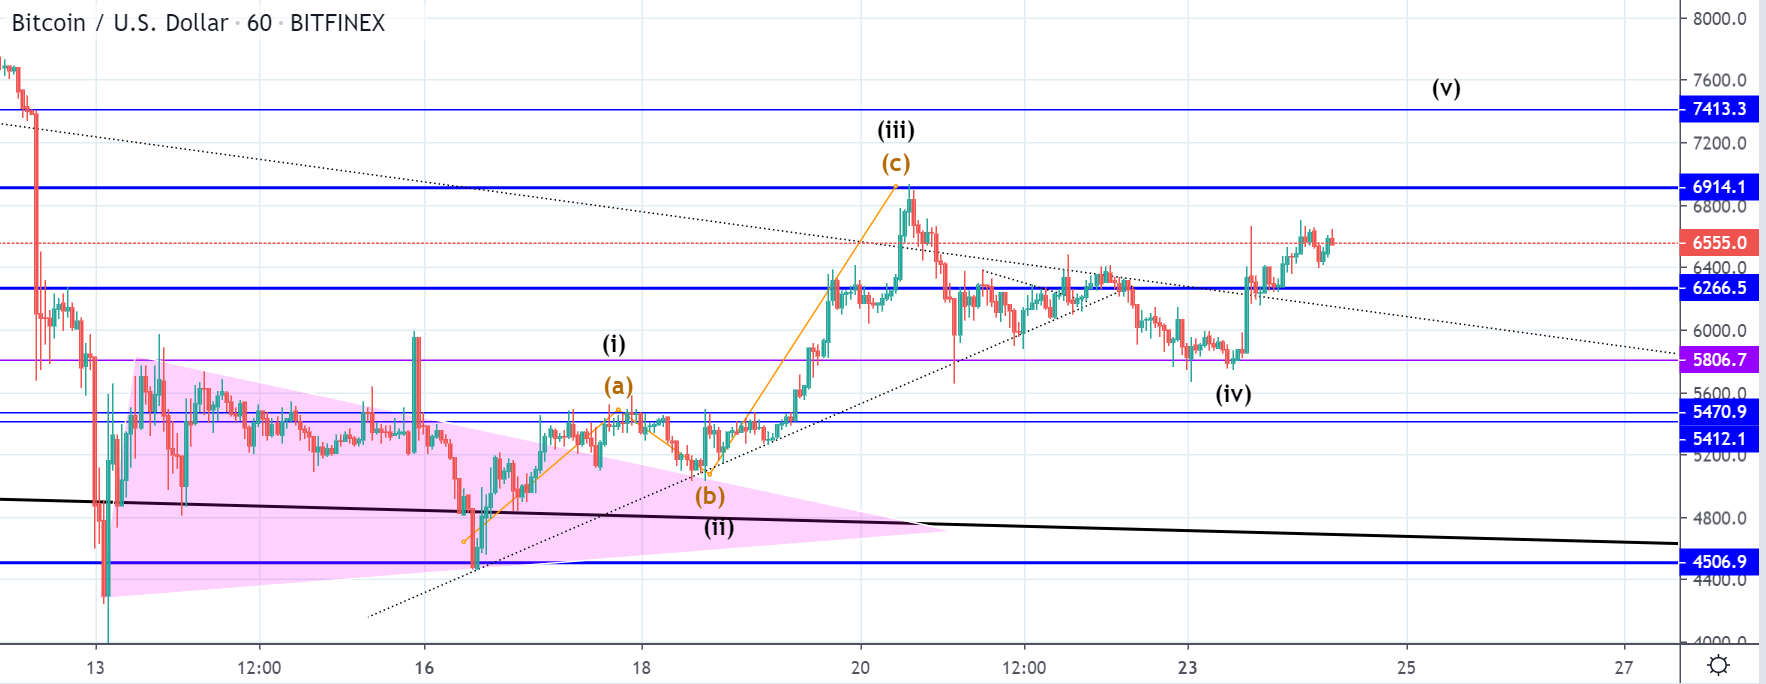 On the hourly chart, we can see that the price managed to come above it’s horizontal resistance level at $6266 which is a significant one but still hasn’t interacted with the upper at $6914 which was retested on the prior high and confirmed that it serves as resistance now that the price fell below it on the 12th of March.
Prior to this increase we have seen a descending move from the mentioned upper resistance level to the $5800 area where the price found support which was a decrease of 16%. This decrease could have been the 4th wave out of the next staring five-wave impulse to the upside especially considering that it developed in a three-wave manner and not in one go.
If this is true then the increase we are currently seeing in development would be it’s ending wave which can exceed the prior high but could also end around its vicinity as a truncation. Considering how significant the $6914 level is I believe that the second would be more likely and with the price action forming an ascending channel after a coming above $6266 this could have already started.
Another possibility would be that we aren’t seeing a five-wave impulse but instead an ABC correction to the upside. Although this is starting to get invalidated we could be seeing the development of another ABC to the downside or some kind of a complex correction (WXY or WXYXZ) out of which the ABC to the upside was it’s first wave.
If the price manages to move back above the prior high it would mean that we are seeing the five-wave impulse but if it starts decreasing again without coming to at least its vicinity there could be a possibility of further lower lows before the start of the expected recovery.
XRP/USD
The price of Ripple has increased by 9.27% coming from yesterday’s low at $0.148 to $0.1617 at it’s highest point today so far.
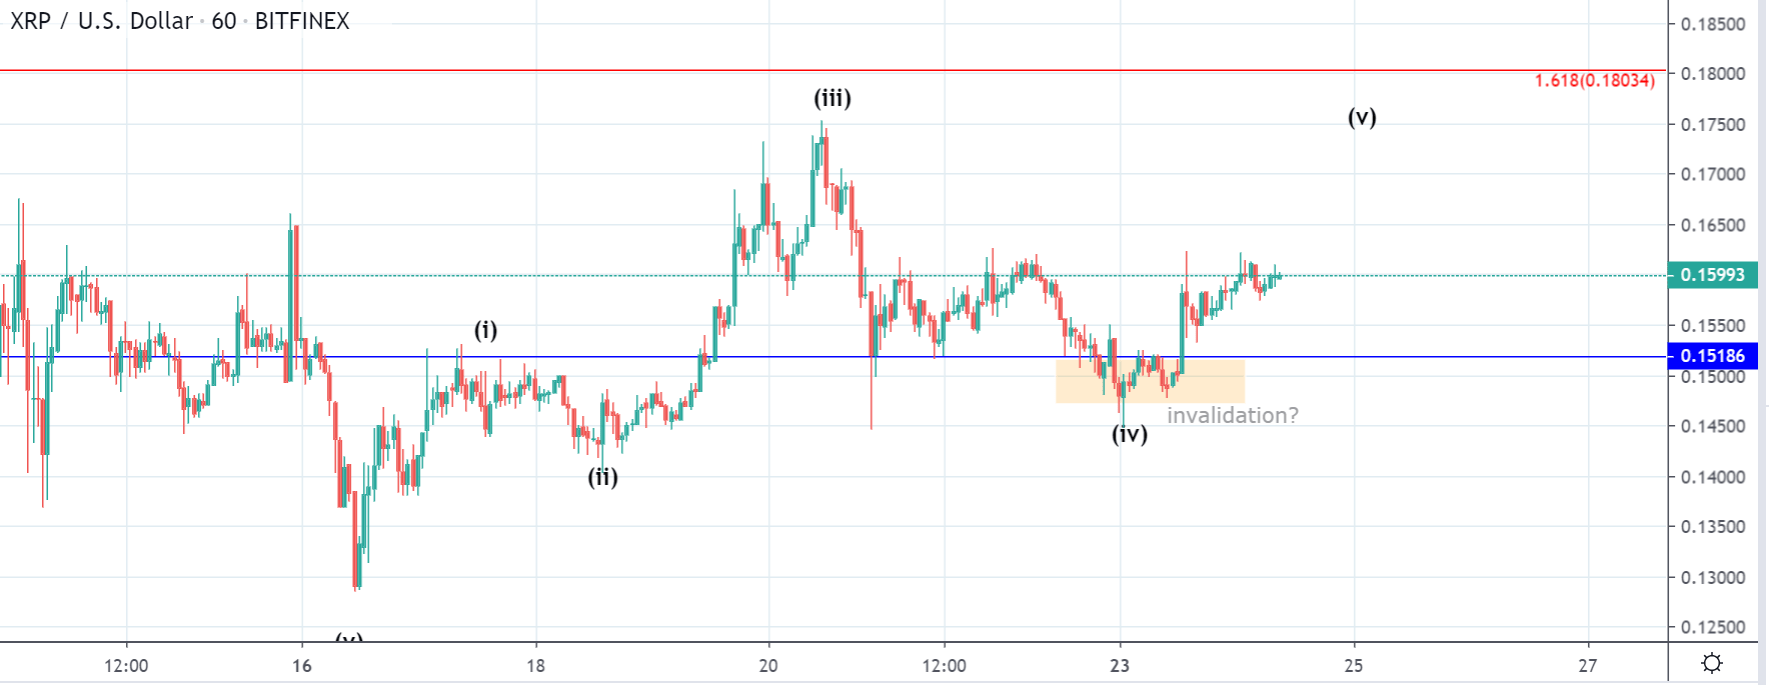 Looking at the hourly chart, you can see a similar situation like in the case of Bitcoin as the price action is making a similar pathway but unlike in the case of Bitcoin the presumed 4th wave has dipped inside the territory of the 1st wave.
This could be an early indication that this increase isn’t an impulsive one as the count could get invalidated but we are still to have a clear confirmation.
FXOpen offers the world's most popular cryptocurrency CFDs*, including Bitcoin and Ethereum. Floating spreads, 1:2 leverage — at your service. Open your trading account now or learn more about crypto CFD trading with FXOpen.
*At FXOpen UK and FXOpen AU, Cryptocurrency CFDs are only available for trading by those clients categorised as Professional clients under FCA Rules and Professional clients under ASIC Rules respectively. They are not available for trading by Retail clients.
This article represents the opinion of the Companies operating under the FXOpen brand only. It is not to be construed as an offer, solicitation, or recommendation with respect to products and services provided by the Companies operating under the FXOpen brand, nor is it to be considered financial advice.
Latest articles

Google Share Price Rose Post-market to a New All-time Record
Yesterday, after the close of the main trading session, a report on activities for the 1st quarter of Alphabet Inc. (Google's parent company) was published. The report was strong, exceeding investors' expectations.
→ Quarterly EPS = USD 1.89 (expected = USD 1.

S&P 500 Rebounds after Negative GDP News
Data released yesterday showed US GDP growth slowed to 1.6% in the first quarter of the year. According to ForexFactory: forecast = 2.2%, past value = 2.4%.
Reaction to the news sent the S&P 500 mini stock

GBP/USD And USD/CAD Daily Chart Outlook
GBP/USD is attempting a recovery wave from 1.2300. USD/CAD is consolidating and might aim for a move above the 1.3760 resistance zone.
Important Takeaways for GBP/USD and USD/CAD Analysis Today
· The British Pound started