


FXOpen
A lot has happened since our last bitcoin update. Last week BTC/USD was (barely) holding onto the $10,000 mark but by Tuesday we dropped to a low of $5,980 dollars. Litecoin saw lows at $105 dollars before a bitcoin-led bounce took it out of the doldrums.
Bitcoin Drops by 40 Percent in 6 Days
The news about the Tether subpoena last week shook market confidence. Bitcoin prices dropped by 40 percent in 6 days to hit a low of $5,980 dollars. Here we got somewhat of a rally to $8,468 dollars but there is no certainty that this will be more then a ‘dead cat’ bounce. We are quoted at $7,568 dollars right now, much below the $19,850 all-time high.
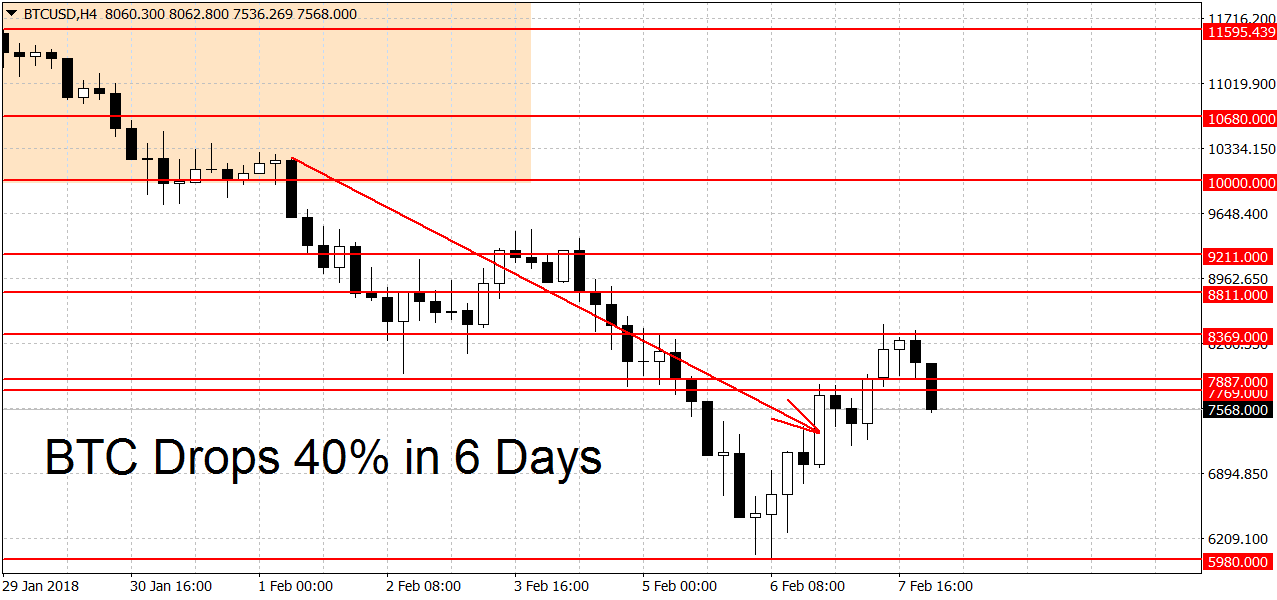
The downtrend on the daily charts continues. To end it the bulls will need to push prices above $12,000 dollars. A new uptrend requires a breakout above the $12,982 swing high. Support on the way down can be found at the most recent swing low at $5,980 followed by the $5,000 round figure. This is an important milestone for BTC/USD as well as a previous major resistance. A clear break of this level could lead to more BTC losses. On the longer-term weekly charts bitcoin is range-bound. The monthly charts are still keeping the bullish bias.
Litecoin Drops to $105 Dollars
Litecoin again followed BTC/USD lower as it broke the $10,000 handle. The coin dropped from $161 dollars all the way down to $106.20 during the initial dump, a loss of 34 percent. The bounce then took LTC/USD all the way to $173.25 dollars as news emerged about Litepay, a litecoin payment processor.
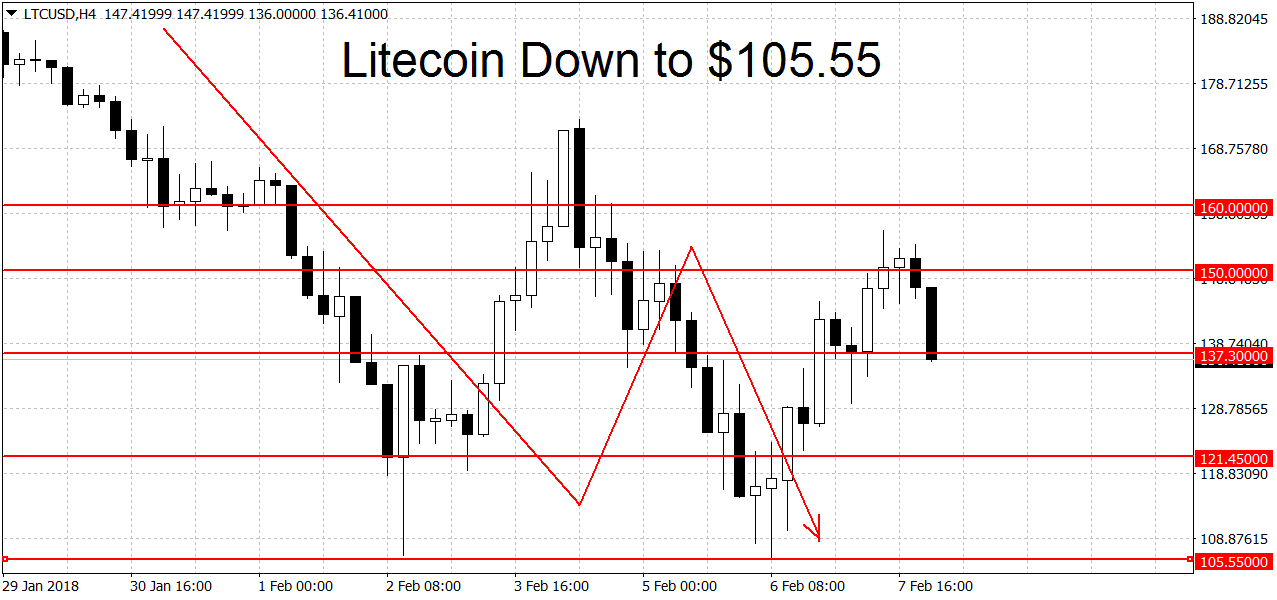
However as we can see on the chart above those gains couldn’t be sustained as the bears used the high prices to sell into support. The second push lower double-bottomed nearly at the same spot, this time hitting $105.55 dollars. This area along with the $100 round figure remain as strong support. A decisive break of $100 dollars could lead to further LTC losses.
Litecoin remains in a downtrend on the daily charts. On the upside the bulls need a break above $181 dollars to end the downtrend. But a new rally requires a move above the $214 swing high as well. On the weekly charts LTC/USD remains in rally mode but a move below $100 dollars could change that. On the monthlies litecoin is keeping the bullish bias.
Trade bitcoin on MetaTrader 4 platform with FXOpen broker
FXOpen offers the world's most popular cryptocurrency CFDs*, including Bitcoin and Ethereum. Floating spreads, 1:2 leverage — at your service. Open your trading account now or learn more about crypto CFD trading with FXOpen.
*At FXOpen UK and FXOpen AU, Cryptocurrency CFDs are only available for trading by those clients categorised as Professional clients under FCA Rules and Professional clients under ASIC Rules respectively. They are not available for trading by Retail clients.
This article represents the opinion of the Companies operating under the FXOpen brand only. It is not to be construed as an offer, solicitation, or recommendation with respect to products and services provided by the Companies operating under the FXOpen brand, nor is it to be considered financial advice.
Latest articles

Google Share Price Rose Post-market to a New All-time Record
Yesterday, after the close of the main trading session, a report on activities for the 1st quarter of Alphabet Inc. (Google's parent company) was published. The report was strong, exceeding investors' expectations.
→ Quarterly EPS = USD 1.89 (expected = USD 1.

S&P 500 Rebounds after Negative GDP News
Data released yesterday showed US GDP growth slowed to 1.6% in the first quarter of the year. According to ForexFactory: forecast = 2.2%, past value = 2.4%.
Reaction to the news sent the S&P 500 mini stock

GBP/USD And USD/CAD Daily Chart Outlook
GBP/USD is attempting a recovery wave from 1.2300. USD/CAD is consolidating and might aim for a move above the 1.3760 resistance zone.
Important Takeaways for GBP/USD and USD/CAD Analysis Today
· The British Pound started