


FXOpen
AUD/USD found support near 0.7190-0.7200 and it is currently consolidating. NZD/USD looks set to gain pace above the 0.6890 resistance area in the near term.
Important Takeaways for AUD/USD and NZD/USD
- The Aussie Dollar declined heavily recently before buyers appeared near 0.7190 against the US Dollar.
- There was a break above a key connecting bearish trend line with resistance at 0.7218 on the hourly chart of AUD/USD.
- NZD/USD is currently trading nicely above the 0.6870 support level, with a positive angle.
- There was a break above a short term bearish trend line with resistance at 0.6880 on the hourly chart.
AUD/USD Technical Analysis
After forming a top near the 0.7390 level, the Aussie Dollar declined sharply against the US Dollar. The AUD/USD pair declined and broke the 0.7300 and 0.7280 support levels.
The pair even traded below the 0.7220 level and the 50 hourly simple moving average. It even spiked below the 0.7200 handle and formed a low near the 0.7190 level on FXOpen. Later, the pair started a decent upward correction and traded above the 0.7200 level.
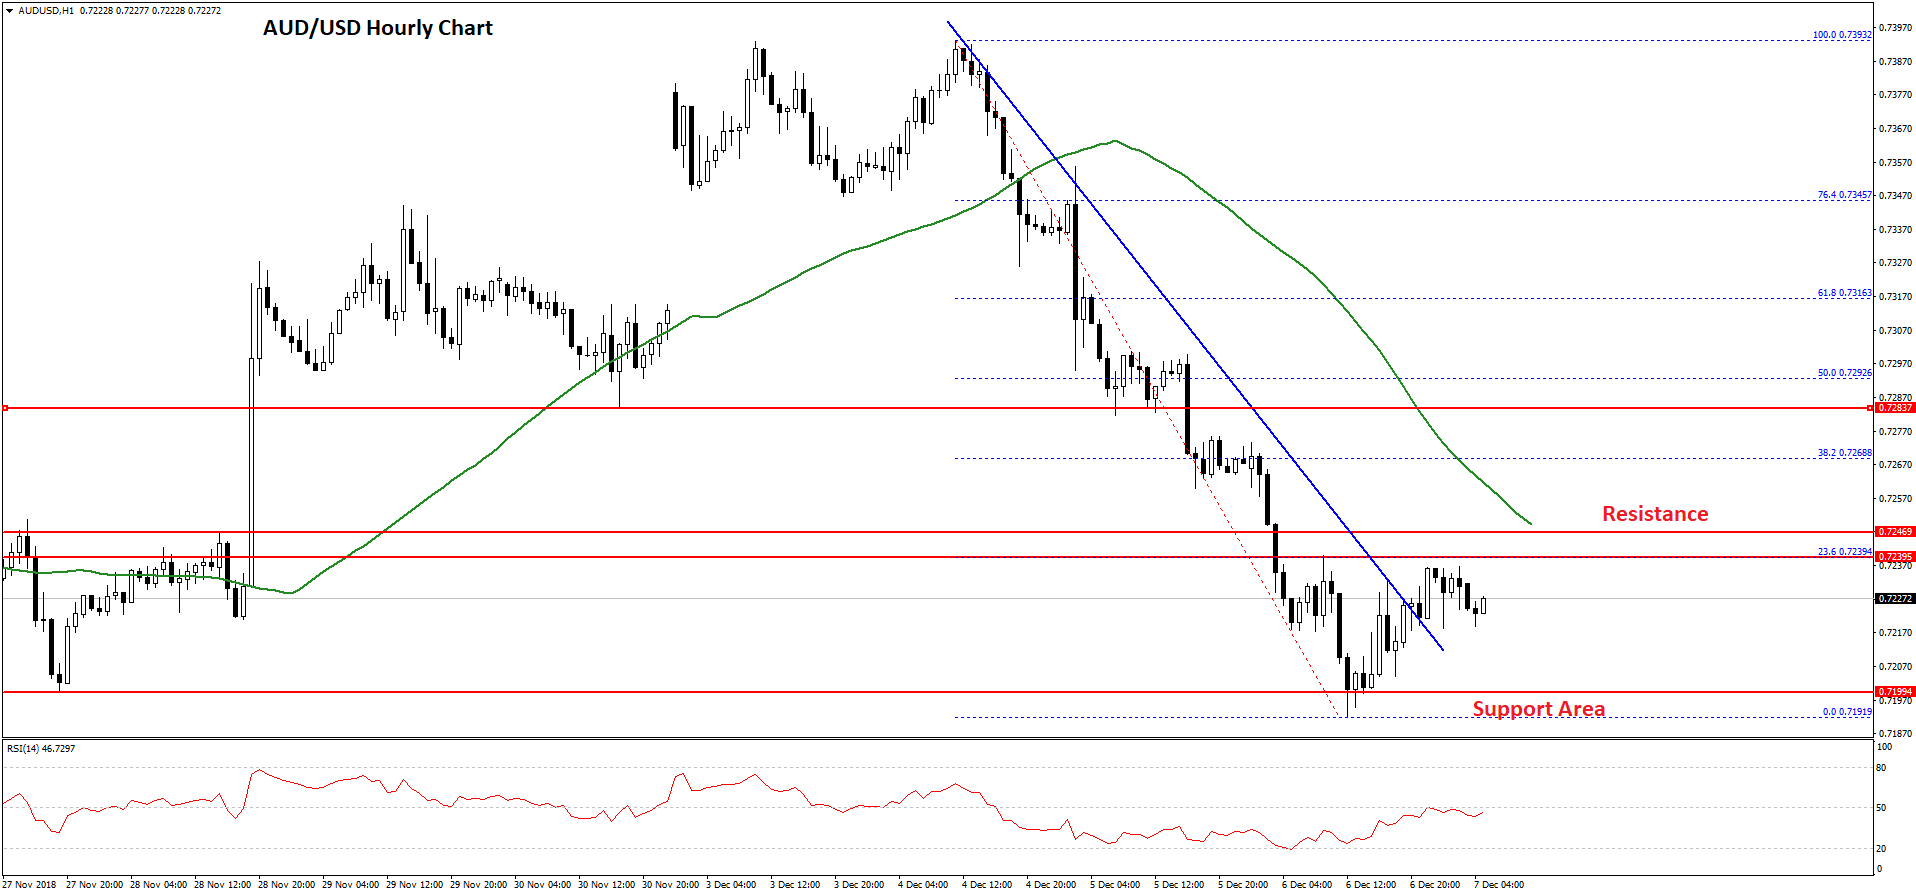
There was also a break above a key connecting bearish trend line with resistance at 0.7218 on the hourly chart. The pair is currently trading near the 0.7235 resistance and the 23.6% Fib retracement level of the recent decline from the 0.7393 high to 0.7191 low.
Above 0.7240, the pair is likely to face sellers near the 0.7250 level and the 50 hourly simple moving average. The main resistance for buyers is near the 0.7265 level and the 50% Fib retracement level of the recent decline from the 0.7393 high to 0.7191 low.
On the downside, an initial support is near the 0.7220 level followed by 0.7200. If there are more losses, the pair is likely to revisit the 0.7180 level.
The overall price action is positive and it seems like AUD/USD may continue to correct higher towards 0.7250 and 0.7265 in the coming sessions.
NZD/USD Technical Analysis
After a solid upward move, the New Zealand Dollar faced sellers near the 0.6970 level against the US Dollar. The NZD/USD pair started a downside move and traded below the 0.6940 and 0.6900 support levels.
There was even a close below the 0.6900 support and the 50 hourly simple moving average. The pair traded as low as 0.6856 and later started a fresh upward move. It climbed above the 0.6860 and 0.6870 levels with a positive angle.
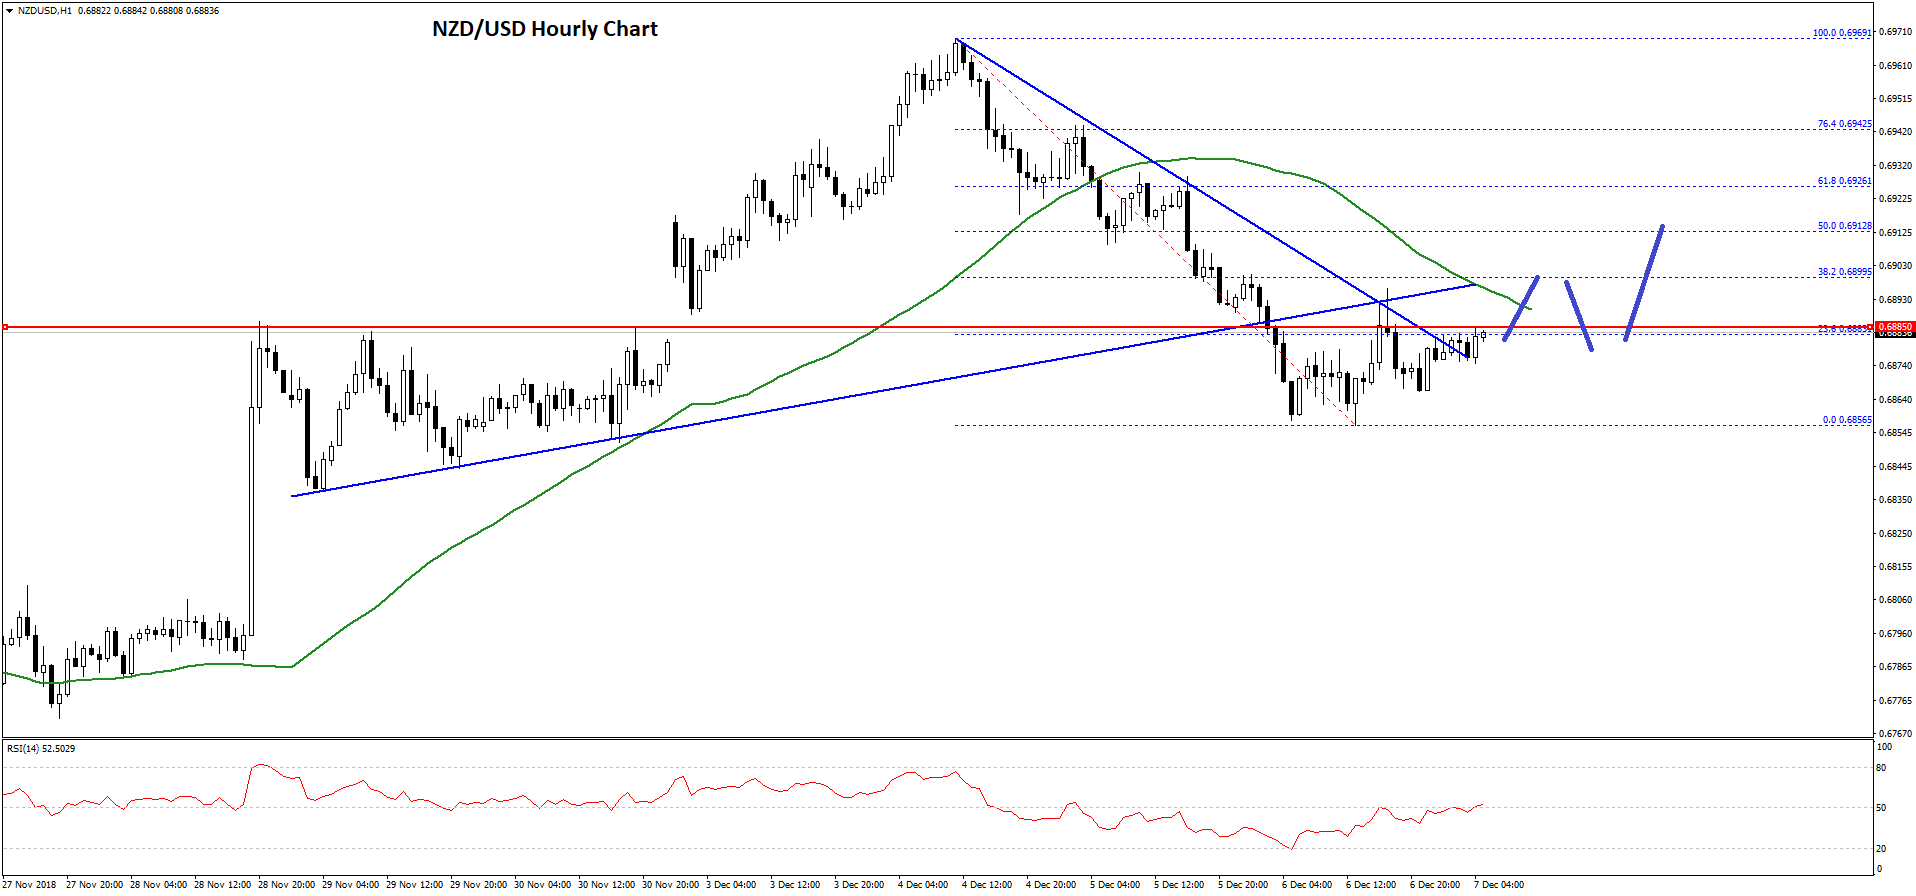
The pair broke the 23.6% Fib retracement level of the recent decline from the 0.6969 high to 0.6856 low. Moreover, there was a break above a short term bearish trend line with resistance at 0.6880 on the hourly chart, opening the doors for more gains.
A successful break above the 0.6840 level and the 50 hourly SMA could open the doors for more upsides in the near term. The next resistance may be near the 0.6910 level and the 50% Fib retracement level of the recent decline from the 0.6969 high to 0.6856 low.
On the downside, an initial support is at 0.6870, below which the pair may test the 0.6855 level. As long as the pair is above 0.6855, there are chances of more upsides above 0.6880 and 0.6900 in the near term.
Trade over 50 forex markets 24 hours a day with FXOpen. Take advantage of low commissions, deep liquidity, and spreads from 0.0 pips. Open your FXOpen account now or learn more about trading forex with FXOpen.
This article represents the opinion of the Companies operating under the FXOpen brand only. It is not to be construed as an offer, solicitation, or recommendation with respect to products and services provided by the Companies operating under the FXOpen brand, nor is it to be considered financial advice.
Latest from Forex Analysis
Latest articles

AUD/USD Analysis: Aussie Weakens After RBA Decision
Following its decision on 7th May, the Reserve Bank of Australia (RBA) opted to maintain the interest rate at 4.35%, despite inflation continuing to decrease at a slower pace than anticipated by the RBA.
"I think we still think
The Hang Seng Index Has Risen by Over 13% in 2 Weeks
Analyzing the Hang Seng (Hong Kong 50 at FXOpen) chart, we wrote on January 30th that the price was near an important support level formed by the lower boundary (shown in orange) of a long-term channel, which has been relevant

Turtle Trading: System, Rules, and Strategy
In the 1980s, the Turtle Trading system was born from a debate about whether trading skills were innate or could be taught. Richard Dennis and William Eckhardt decided to train novices in their trend-following trading strategies, thus giving rise to