


FXOpen

GBP/USD is gaining pace above the 1.2660 resistance. EUR/GBP declined steadily below the 0.8572 and 0.8566 support levels.
Important Takeaways for GBP/USD and EUR/GBP Analysis Today
· The British Pound is attempting a fresh increase above 1.2660.
· There is a key bullish trend line forming with support near 1.2670 on the hourly chart of GBP/USD at FXOpen.
· EUR/GBP is trading in a bearish zone below the 0.8572 pivot level.
· There is a connecting bearish trend line forming with resistance near 0.8562 on the hourly chart at FXOpen.
GBP/USD Technical Analysis
On the hourly chart of GBP/USD at FXOpen, the pair remained well-bid above the 1.2575 level. The British Pound started a decent increase above the 1.2605 zone against the US Dollar.
The bulls were able to push the pair above the 50-hour simple moving average and 1.2660. The pair even climbed above 1.2700 and traded as high as 1.2709. It is now correcting gains below the 23.6% Fib retracement level of the upward move from the 1.2574 swing low to the 1.2709 high.
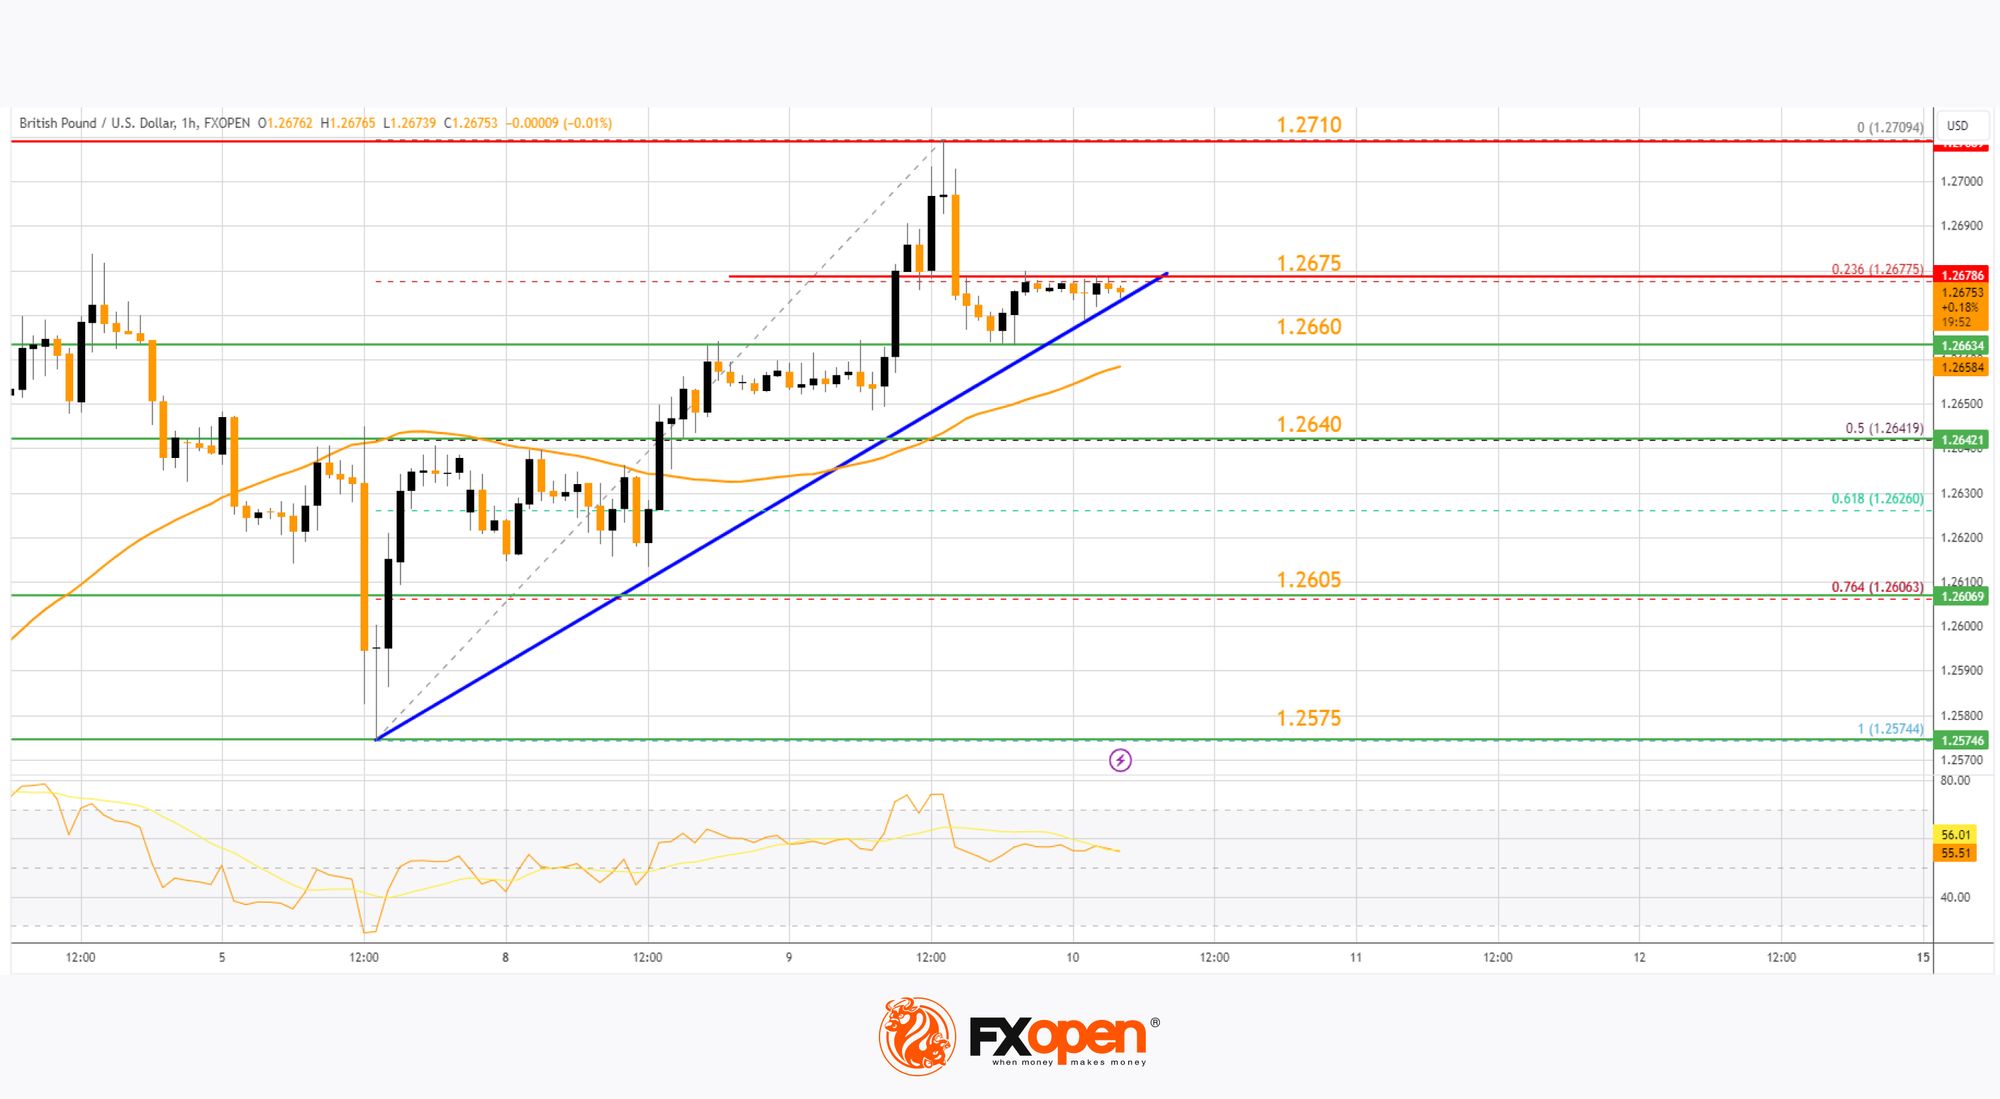
On the upside, the GBP/USD chart indicates that the pair is facing resistance near 1.2675. The next major resistance is near 1.2710.
A close above the 1.2710 resistance zone could open the doors for a move toward 1.2740. Any more gains might send GBP/USD toward 1.2800. On the downside, there is a key support forming near a bullish trend line at 1.2670.
If there is a downside break below 1.2670 and 1.2660, the pair could accelerate lower. The next major support is near the 50% Fib retracement level of the upward move from the 1.2574 swing low to the 1.2709 high at 1.2640.
The next key support is seen near 1.2605, below which the pair could test 1.2575. Any more losses could lead the pair toward the 1.2500 support.
EUR/GBP Technical Analysis
On the hourly chart of EUR/GBP at FXOpen, the pair started a steady decline from well above 0.8580. The Euro traded below the 0.8572 and 0.8566 support levels against the British Pound.
The EUR/GBP chart suggests that the pair even declined below the 0.8562 level and tested 0.8560. It is now consolidating losses and trading below the 50-hour simple moving average. The pair is now facing resistance near a connecting bearish trend line at 0.8562.
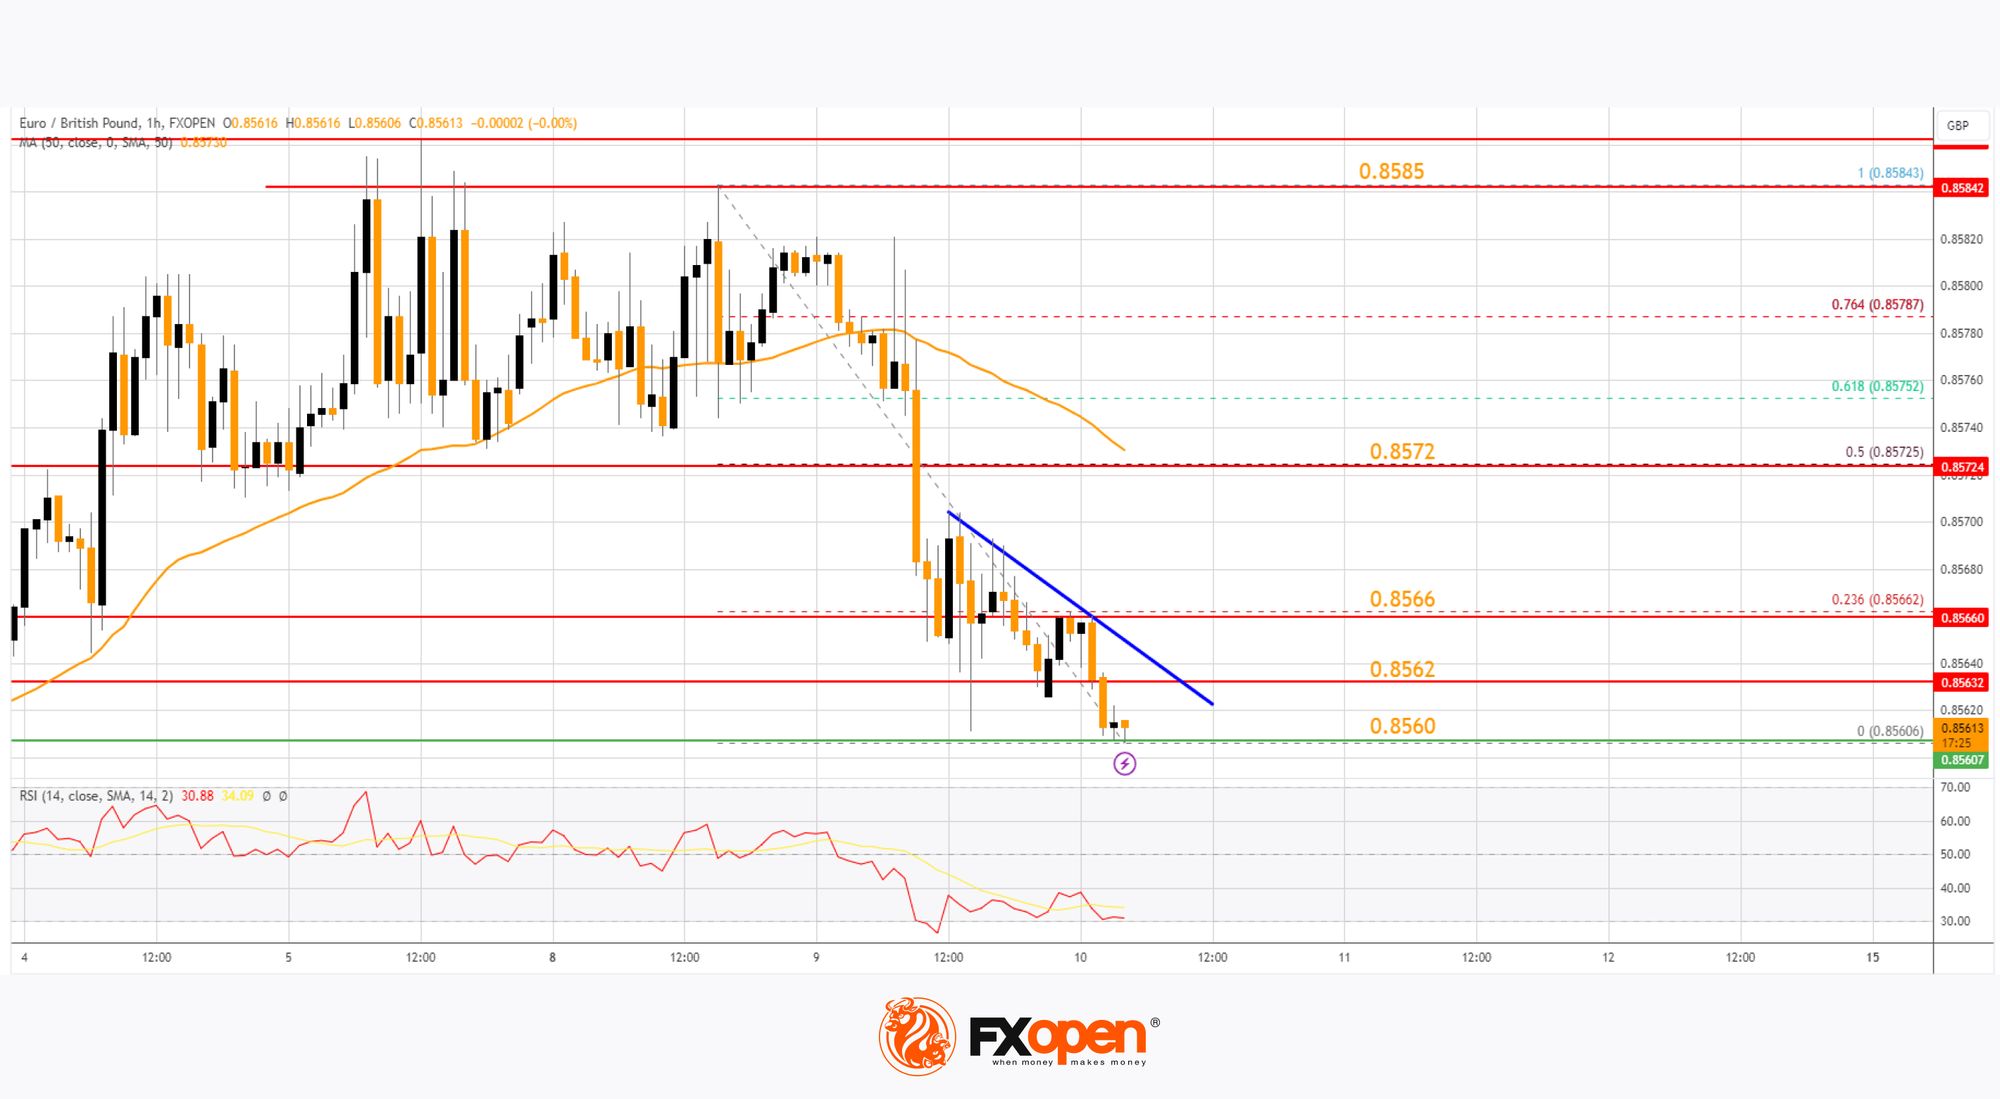
It is close to the 23.6% Fib retracement level of the downward move from the 0.8584 swing high to the 0.8560 low. The next major resistance could be 0.8572.
The 50% Fib retracement level of the downward move from the 0.8584 swing high to the 0.8560 low is also at 0.8572. A close above the 0.8572 level might accelerate gains. In the stated case, the bulls may perhaps aim for a test of 0.8585. Any more gains might send the pair toward the 0.8620 level.
Immediate support sits near 0.8560. The next major support is near 0.8525. A downside break below the 0.8525 support might call for more downsides. In the stated case, the pair could drop toward the 0.8500 support level.
Trade over 50 forex markets 24 hours a day with FXOpen. Take advantage of low commissions, deep liquidity, and spreads from 0.0 pips. Open your FXOpen account now or learn more about trading forex with FXOpen.
This article represents the opinion of the Companies operating under the FXOpen brand only. It is not to be construed as an offer, solicitation, or recommendation with respect to products and services provided by the Companies operating under the FXOpen brand, nor is it to be considered financial advice.
Latest from Forex Analysis
Latest articles

How to Identify and Trade Liquidity Grabs
Understanding the intricacies of market liquidity and the role of liquidity grabs can be crucial for optimising trading strategies. Liquidity grabs, creating rapid price movements, are a key component of Smart Money trading. This article explores how to identify these

What Is a Piercing Line Pattern, and How Can You Trade with It?
In the world of technical analysis, the piercing line pattern stands out as a solid indicator of potential market reversals. This article delves into the nuances of this two-candlestick pattern, exploring its formation, significance, and how traders can effectively leverage
London Calling! FTSE 100 Stocks Flying High Once Again
Back in 2021, which when looking at a physical calendar does not seem such a long time ago yet feels like an epoch ago when considering the changes in global economies and the capital markets since then, the FTSE 100