


FXOpen

EUR/USD started another decline and traded below 1.0700. USD/JPY surged and broke the 154.00 resistance zone.
Important Takeaways for EUR/USD and USD/JPY Analysis Today
· The Euro started a fresh decline below the 1.0695 support zone.
· There was a break above a key bearish trend line with resistance at 1.0630 on the hourly chart of EUR/USD at FXOpen.
· USD/JPY climbed higher above the 153.40 and 154.25 levels.
· There is a connecting bullish trend line forming with support at 154.25 on the hourly chart at FXOpen.
EUR/USD Technical Analysis
On the hourly chart of EUR/USD at FXOpen, the pair struggled to clear the 1.0870 resistance zone. The Euro started a fresh decline and traded below the 1.0755 support zone against the US Dollar, as mentioned in the previous analysis.
The pair even declined below 1.0695 and tested the 1.0600 zone. A low was formed near 1.0601 and the pair is now correcting losses. There was a break above a key bearish trend line with resistance at 1.0630.
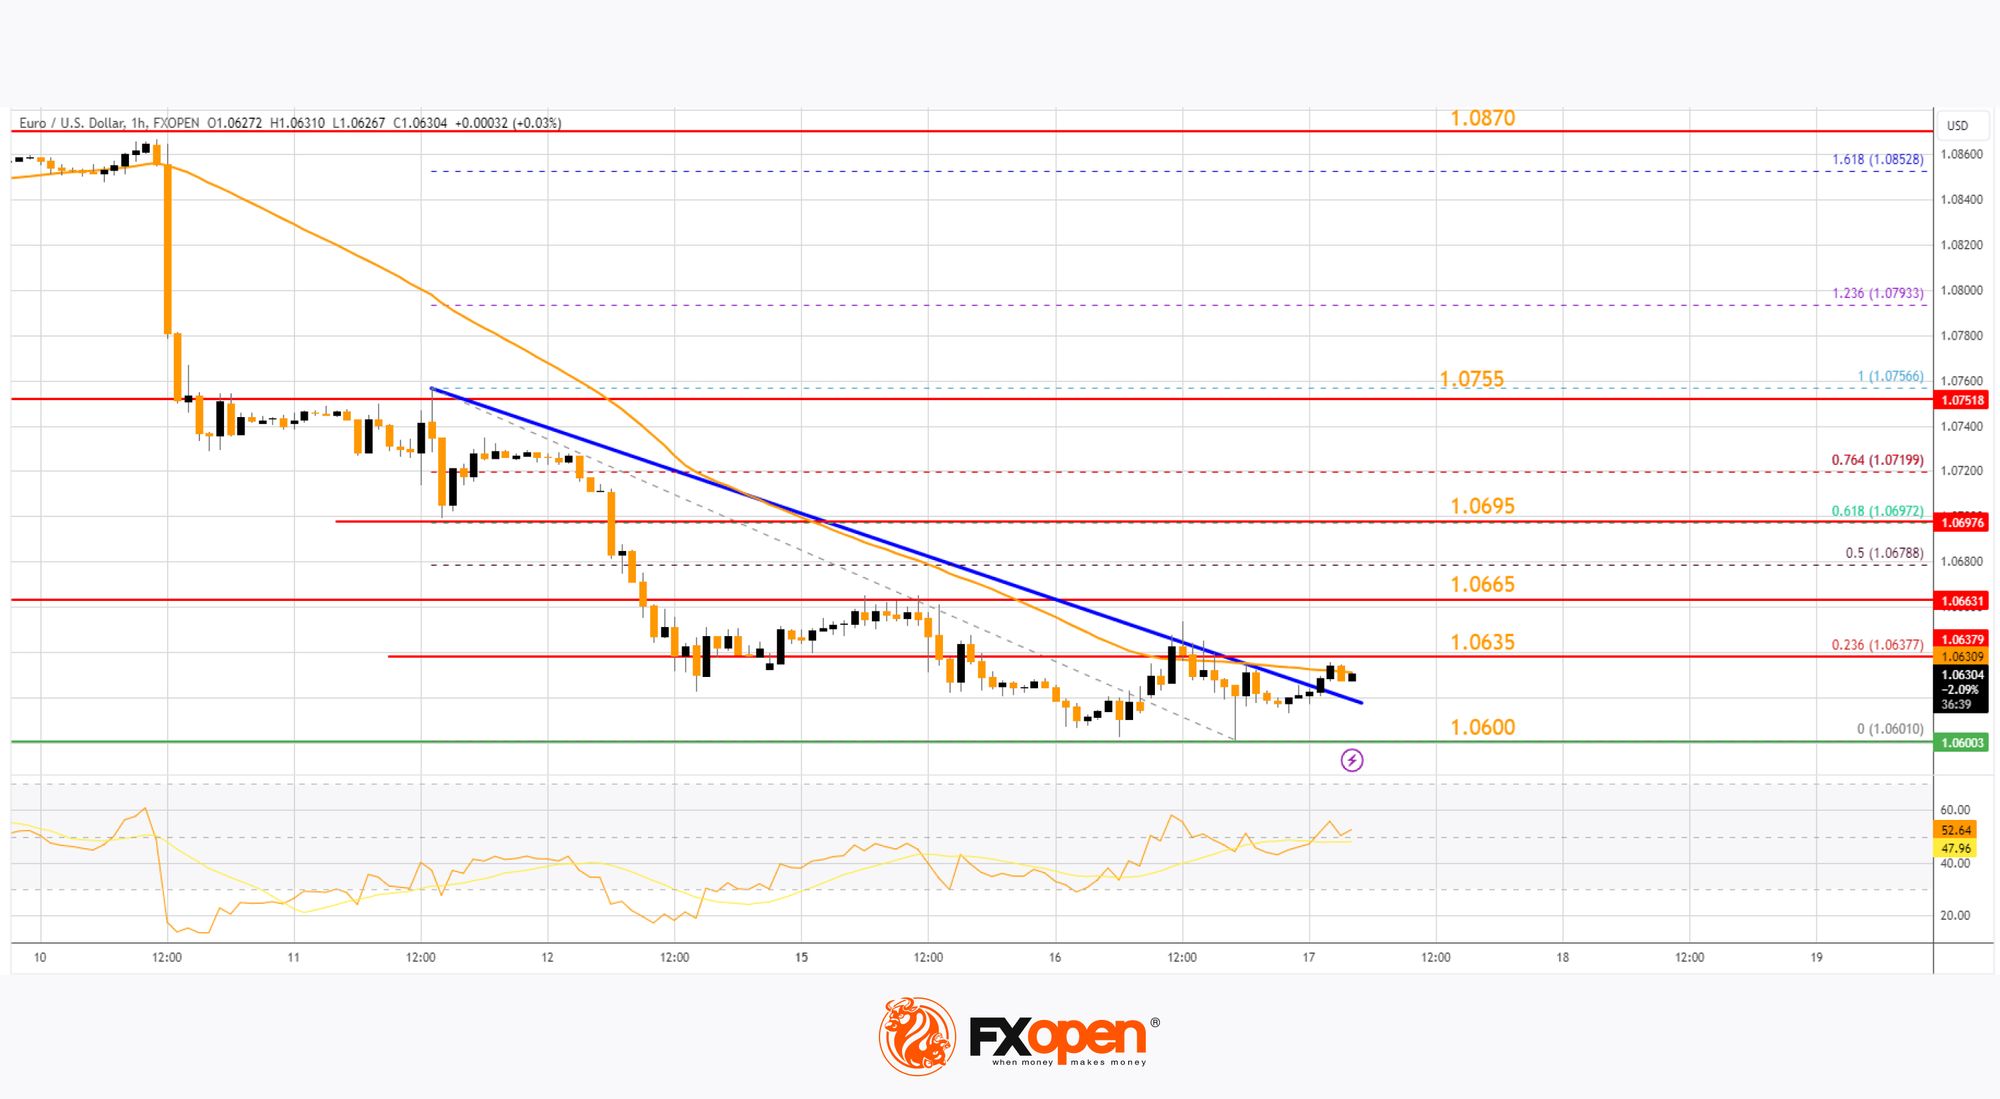
On the upside, the pair is now facing resistance near the 23.6% Fib retracement level of the recent decline from the 1.0755 swing high to the 1.0601 low at 1.0635. The next key resistance is near the 1.0665 level.
The main resistance is 1.0695 or the 61.8% Fib retracement level of the recent decline from the 1.0755 swing high to the 1.0601 low. A clear move above the 1.0695 level could send the pair toward the 1.0755 resistance.
An upside break above 1.0755 could set the pace for another increase. In the stated case, the pair might rise toward 1.0870. If not, the pair might resume its decline. The first major support on the EUR/USD chart is near 1.0600.
The next key support is at 1.0580. If there is a downside break below 1.0580, the pair could drop toward 1.0565. The next support is near 1.0550, below which the pair could start a major decline.
USD/JPY Technical Analysis
On the hourly chart of USD/JPY at FXOpen, the pair started a strong increase from the 152.60 zone. The US Dollar gained bullish momentum above 153.40 against the Japanese Yen.
It even cleared the 50-hour simple moving average and 154.00. The current price action above the 154.00 level is positive. A high is formed at 154.78 and the pair might continue to rise. Immediate resistance on the USD/JPY chartis near 154.80.
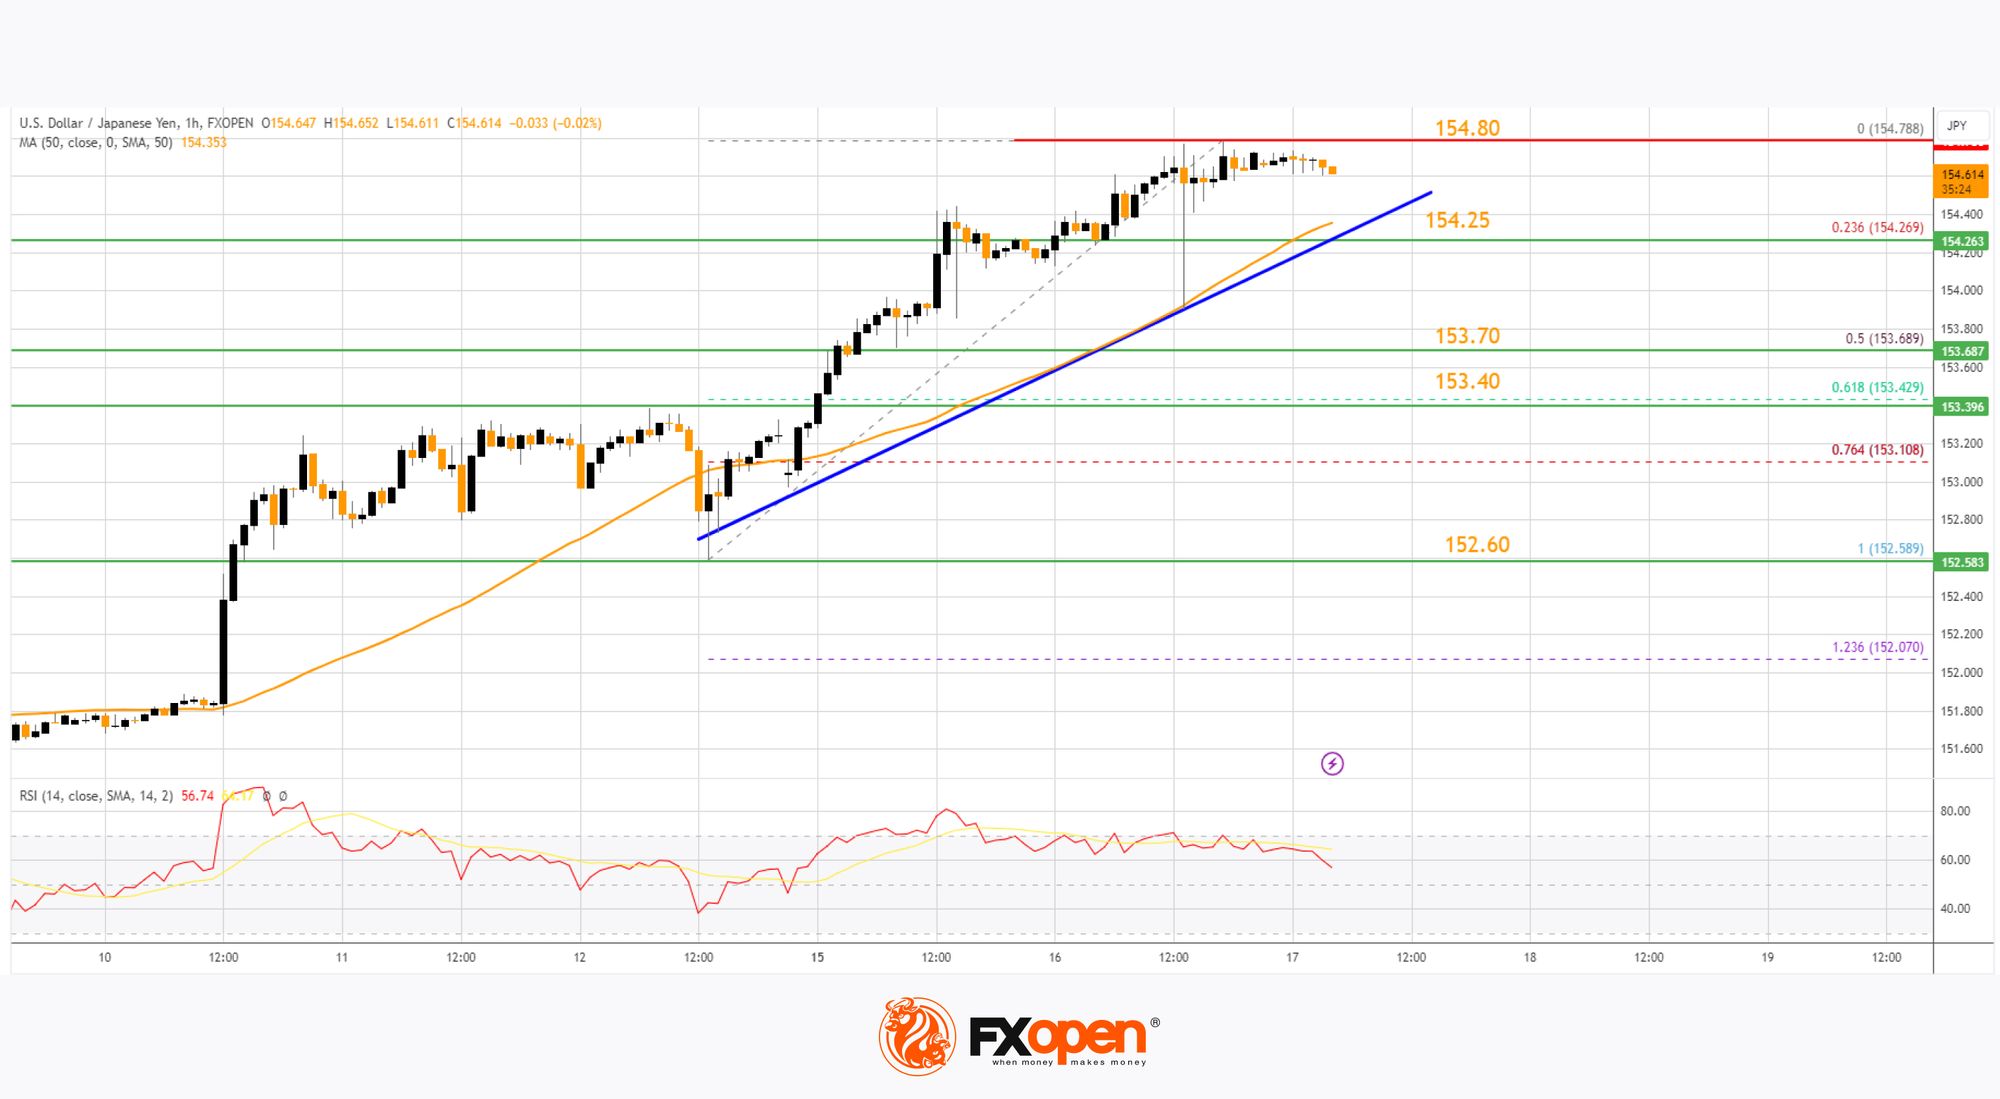
The first major resistance is near 155.00. If there is a close above the 155.00 level and the RSI stays moves 50, the pair could rise toward 155.50. The next major resistance is near 156.20, above which the pair could test 158.00 in the coming days.
On the downside, the first major support is near the 23.6% Fib retracement level of the upward move from the 152.58 swing low to the 154.78 high at 154.25. There is also a connecting bullish trend line forming with support at 154.25.
The next major support is visible near the 50% Fib retracement level of the upward move from the 152.58 swing low to the 154.78 high at 153.70. If there is a close below 153.70, the pair could decline steadily.
In the stated case, the pair might drop toward the 152.60 support zone. The next stop for the bears may perhaps be near the 150.00 region.
Trade over 50 forex markets 24 hours a day with FXOpen. Take advantage of low commissions, deep liquidity, and spreads from 0.0 pips. Open your FXOpen account now or learn more about trading forex with FXOpen.
This article represents the opinion of the Companies operating under the FXOpen brand only. It is not to be construed as an offer, solicitation, or recommendation with respect to products and services provided by the Companies operating under the FXOpen brand, nor is it to be considered financial advice.
Latest from Forex Analysis
Latest articles

What a Mitigation Block Is, and How You Can Use It When Trading Forex
Understanding specific market mechanisms like mitigation blocks may enhance strategic decision-making. This article delves into the concept of mitigation blocks, detailing their definition, function, and practical application within forex.
Definition and Function of a Mitigation Block
A mitigation block in

Kill-Zone Trading in Forex
Kill Zones represent key periods when market volatility and trading volume surge. This article delves into the concept of Kill Zones, their strategic importance, and practical insights on how traders can leverage these windows for effective trading.
Understanding Kill Zones

How to Identify and Trade Liquidity Grabs
Understanding the intricacies of market liquidity and the role of liquidity grabs can be crucial for optimising trading strategies. Liquidity grabs, creating rapid price movements, are a key component of Smart Money trading. This article explores how to identify these