


FXOpen
In the current corporate reporting season the US stocks dynamics demonstrate increasingly pessimistic estimates for the American economy prospects. Part of the concerns is the ability of the economy to continue the current growth cycle, which is the second longest in US history.
The outcomes of the reporting season, which started in mid-October, helped the market to keep from falling. Even if there is no active growth in the stock markets, the financial performance of companies was still mostly better than expected, and the average profit rose by more than 20%. At the same time, investors are disappointed with the decline in revenue growth, risks of lower margins and negative corporate forecasts for their own incomes.
For now, quarterly results have already been reported by more than half of US public companies that allow to predict the further market dynamics at the end of the reporting season, as well as to determine the issuers that are most resistant to correction.
Traditionally, reporting season was open by banks. One of the key indicators that analysts pay attention to is credit activity, which continues to grow. For example, in JPMorgan Chase total lending increased by 4%, in Citigroup – by 3%. The decline of this indicator in another banking group, Wells Fargo, by 1% is more likely a consequence of ban with the regulator, which imposed restrictions on the assets growth for this bank, than the general market trend. In addition, JPMorgan Chase recorded the maximum interest income since 2008, reaching $13.8 billion.
The reaction of bank stock prices during the reports publication days does not allow to determine a clear trend. Banks quotes, on average, declined only by 0.12%, which indicates the absence of a clear negative trend. An overall picture in the broad market was similar: the average decline was 0.39% in the release days and 2% in the next five days.
Fall despite success
One of the key reasons for the stock prices fall during the reporting season is a slowdown in revenue growth. If you look at the revenue trends of American public companies, then you can see that the peak had been passed in the second quarter of 2018, after which the growth rates began to decline.
The stock performance in this reporting season shows increasingly pessimistic estimates for the American economy prospects. Part of the concern is the ability of the economy to continue the growth cycle, which is the second longest one in US history. Trade wars and rising interest rates alarm investors. Moreover, IMF lowered its forecast for US GDP growth for the next year to 2.5%.
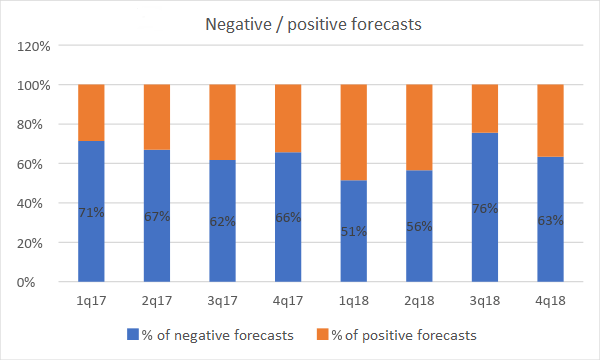
Moreover, companies’ own forecasts are pessimistic. More than 60% of issuers published negative expectations for the fourth quarter, and they turned out to be even worse than analysts’ forecasts.
It is obvious for everyone that American companies are slowing down. Forecasts assume a slowdown in profit growth for the next year. Issuers’ expectations on the average earnings per share (EPS) for the next four quarters declined over the last month by 0.80%, which leads to reevaluation of positions in the market. The effect of fiscal incentives in the form of Trump’s tax reform will fade by the end of the year. At the beginning of 2018, the market predicted an overall increase in profits of American companies by 10% in 2019, now the market is waiting for an increase by only 9%. The comparison is not in favor of the period of the reform launch.
The second important point for investors in this reporting season was the business margin issues. In the context of growing trade barriers, raw material prices and salaries, a steady high margin comes as a key priority, and any threats to business profitability are interpreted by market participants extremely negatively.
Is the crisis just around the corner?
Still, the slowdown is not the end of growth. If the United States remains in a phase of economic recovery, it is too early to sell American companies shares. The leading economic indicators do not yet signal about the risk of recession on the year horizon. The consumer confidence index continues to rise. The yield spread of ten-year and two-year treasury bonds remains positive, and this indicator has been a recession indicator for the last 50 years.
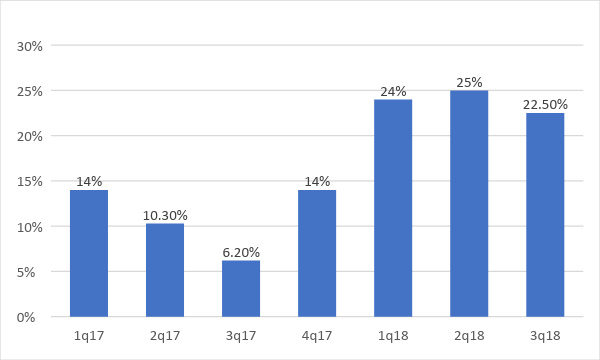
At the end of 2018, the companies’ profit growth should exceed 20%. In the fourth quarter, according to various forecasts, it will be more than 15%. The decline in growth rates to less than 10% in 2019 should not scare investors: in 2017, unequivocal growth indicators did not prevent a good rally in the stock market.
Summarizing, we can say that the current reporting season on the stock platforms was perceived too negative, while in fact it is not so failed. The correction may continue, as it was in 2011 and 2015, but it is unlikely that the fall will exceed 20%, since technically it will put an end to the ten-year bullish trend. As a rule, stock markets meet recession at the peak.
Meantime, there are no signs of an impending crisis, and we should not expect a large-scale fall in stocks. Now we are waiting for Trump and Xi Jinping meeting at the end of November that will shed some light on the outcome of the trade war, then the holiday sales season starts in December. Any of these events can become growth drivers. In any case, a rally without the S&P 500 index reaching 3000 points will be deficient, so we are waiting.
This article represents the opinion of the Companies operating under the FXOpen brand only. It is not to be construed as an offer, solicitation, or recommendation with respect to products and services provided by the Companies operating under the FXOpen brand, nor is it to be considered financial advice.
Latest from Financial Market News
Latest articles

Weekly Market Wrap With Gary Thomson: UK100, USD, GOLD, OIL
Get the latest scoop on the week's hottest headlines, all in one convenient video. Join Gary Thomson, the COO of FXOpen UK, as he breaks down the most significant news reports and shares his expert insights.
- UK100 Share Index Rises

What Is a Darvas Box Theory and How Does It Work in Trading?
The Darvas Box Theory, pioneered by Nicolas Darvas in the 1950s, has transcended its stock market origins to become a valuable tool for forex traders. This method leverages specific price movements and patterns, known as the Darvas Box, to track

NFLX Stock Price Falls Despite Subscriber Growth
Yesterday, after the close of the main trading session on the stock market, Netflix reported to investors for the 1st quarter of 2024.
The report turned out better than expected:
→ earnings per share: actual = USD 5.28, forecast = USD 4.