


FXOpen

Trends are one of the reasons why traders come to financial markets. Riding a trend is easy in principle, but few traders have the nerves and patience to stay in a trade until the trend is over.
Because trends do not form as often as many of us would like, the risk is to exit the market too early. Or, to book the profits ahead of the time.
Statistics tell us that financial markets spend most of the time in consolidation. If that’s the case, mastering the art of riding a trend is crucial for the profitability of a trading account.
Trendlines are here to help. As the name suggests, a trendline is just that: the line of a trend. Its primary purpose is to highlight the trend and to keep the trader on the right side of the market.
What is a Trend?
Before anything, we need to define what a trend is. Bullish and bearish trends have specific market behavior.
A bullish trend, for instance, is nothing but a series of higher highs and higher lows. In other words, the market keeps advancing, making new highs. And, at the same time, all the pullbacks aren’t strong enough to break the previous lower high. For as long as these conditions hold, the market will rise in an upward trend.
The opposite is true for a falling market. It keeps forming new lows, while at the same time the pullbacks aren’t enough to break the previous lower high.
Rules to Ride a Trend
Now that we know what makes a trend let’s see what the rules are to ride it. Naturally, the trendline plays an essential role.
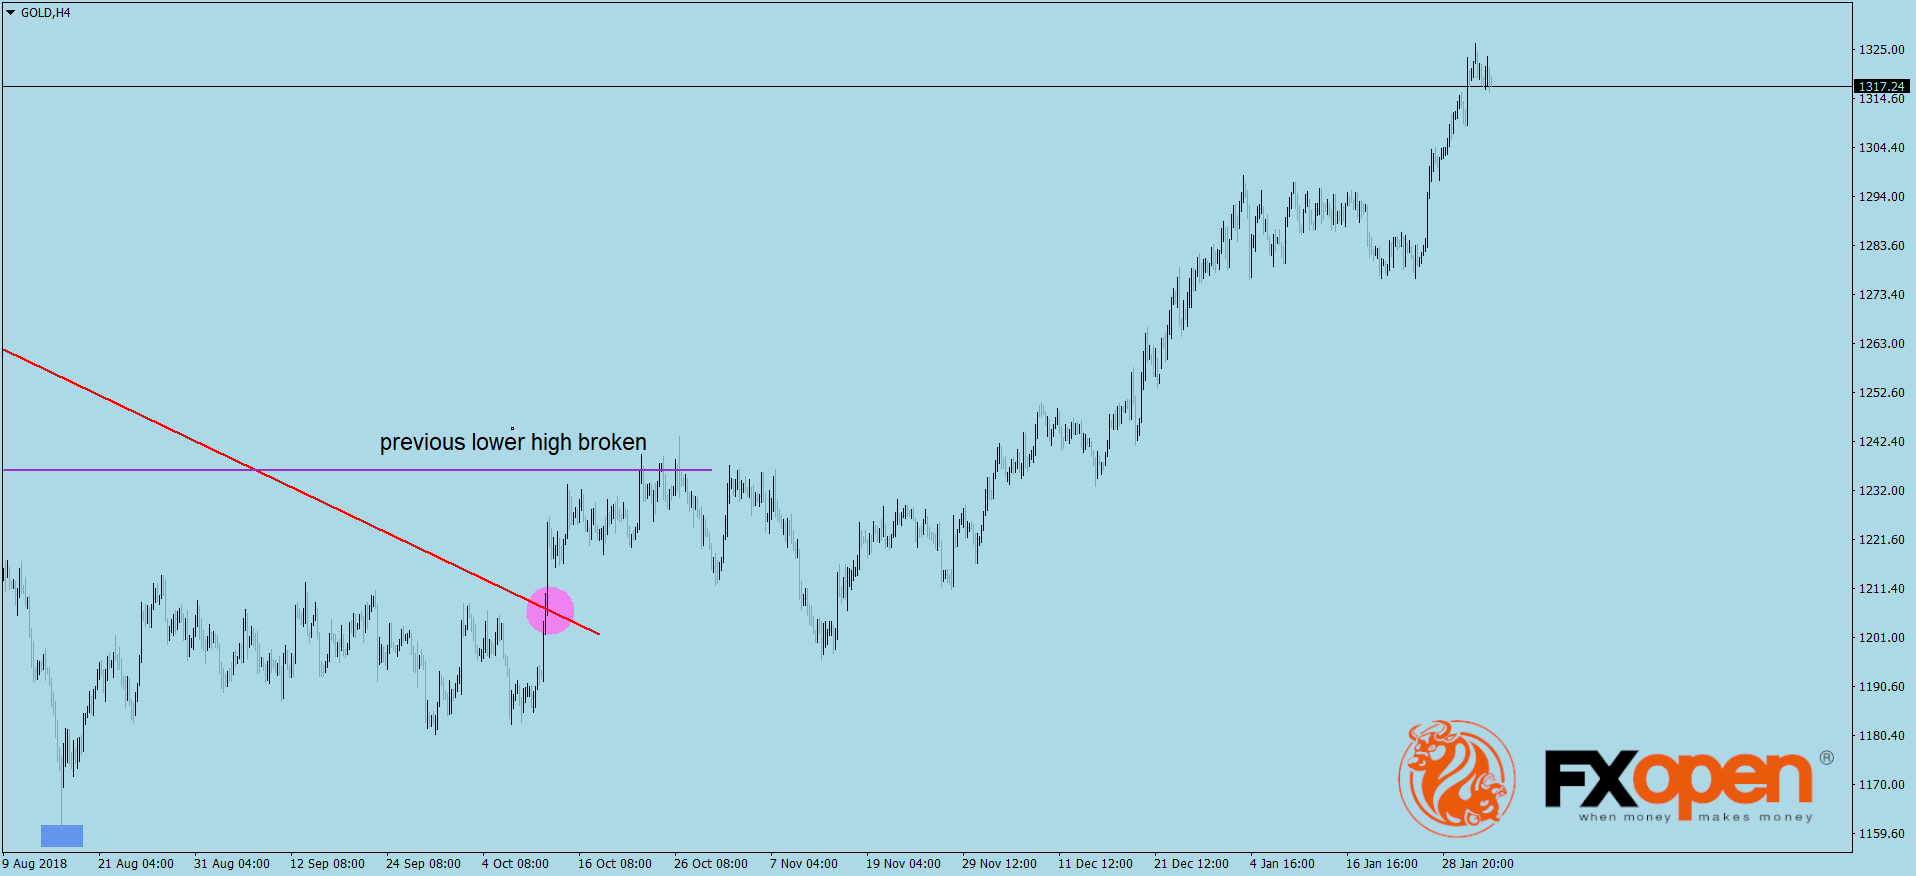
Below is one of the most exciting pair to trade. Called the XAUUSD, it shows the value of gold expressed in USD.
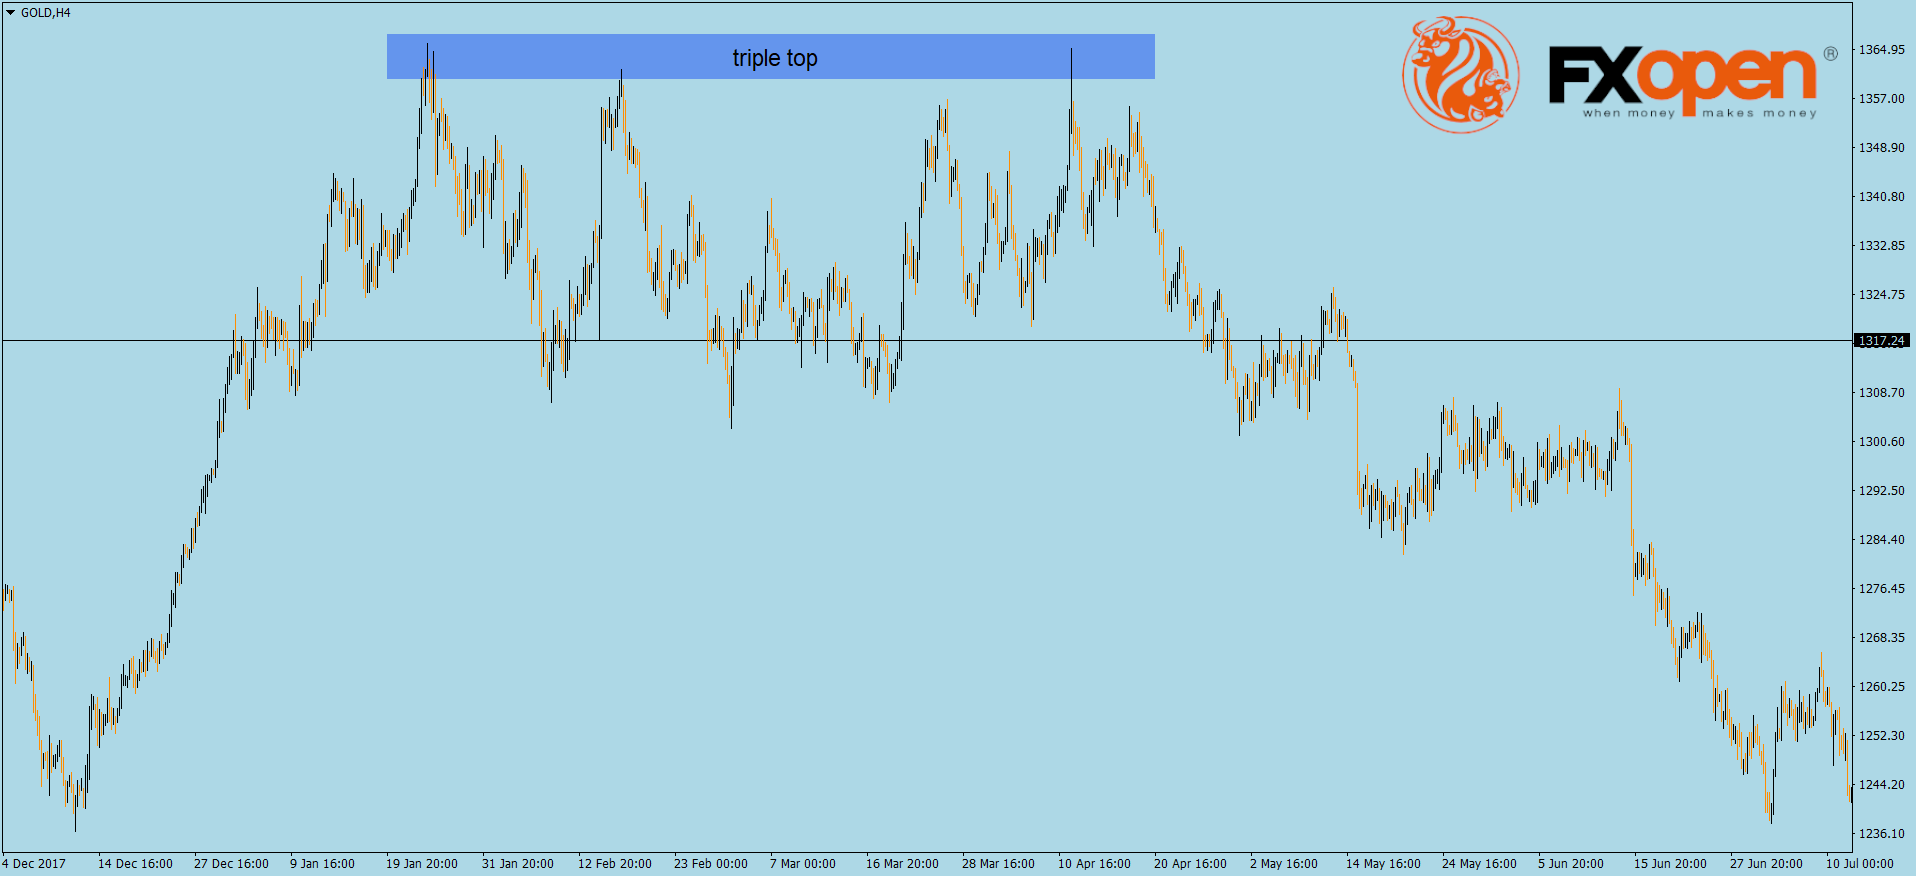
Gold fascinated people for thousands of years and continues to do that. It is a store of value against inflation and part of every conservative portfolio.
Recently, gold made a triple top. A reversal pattern, it shows the inability of the market to keep advancing.
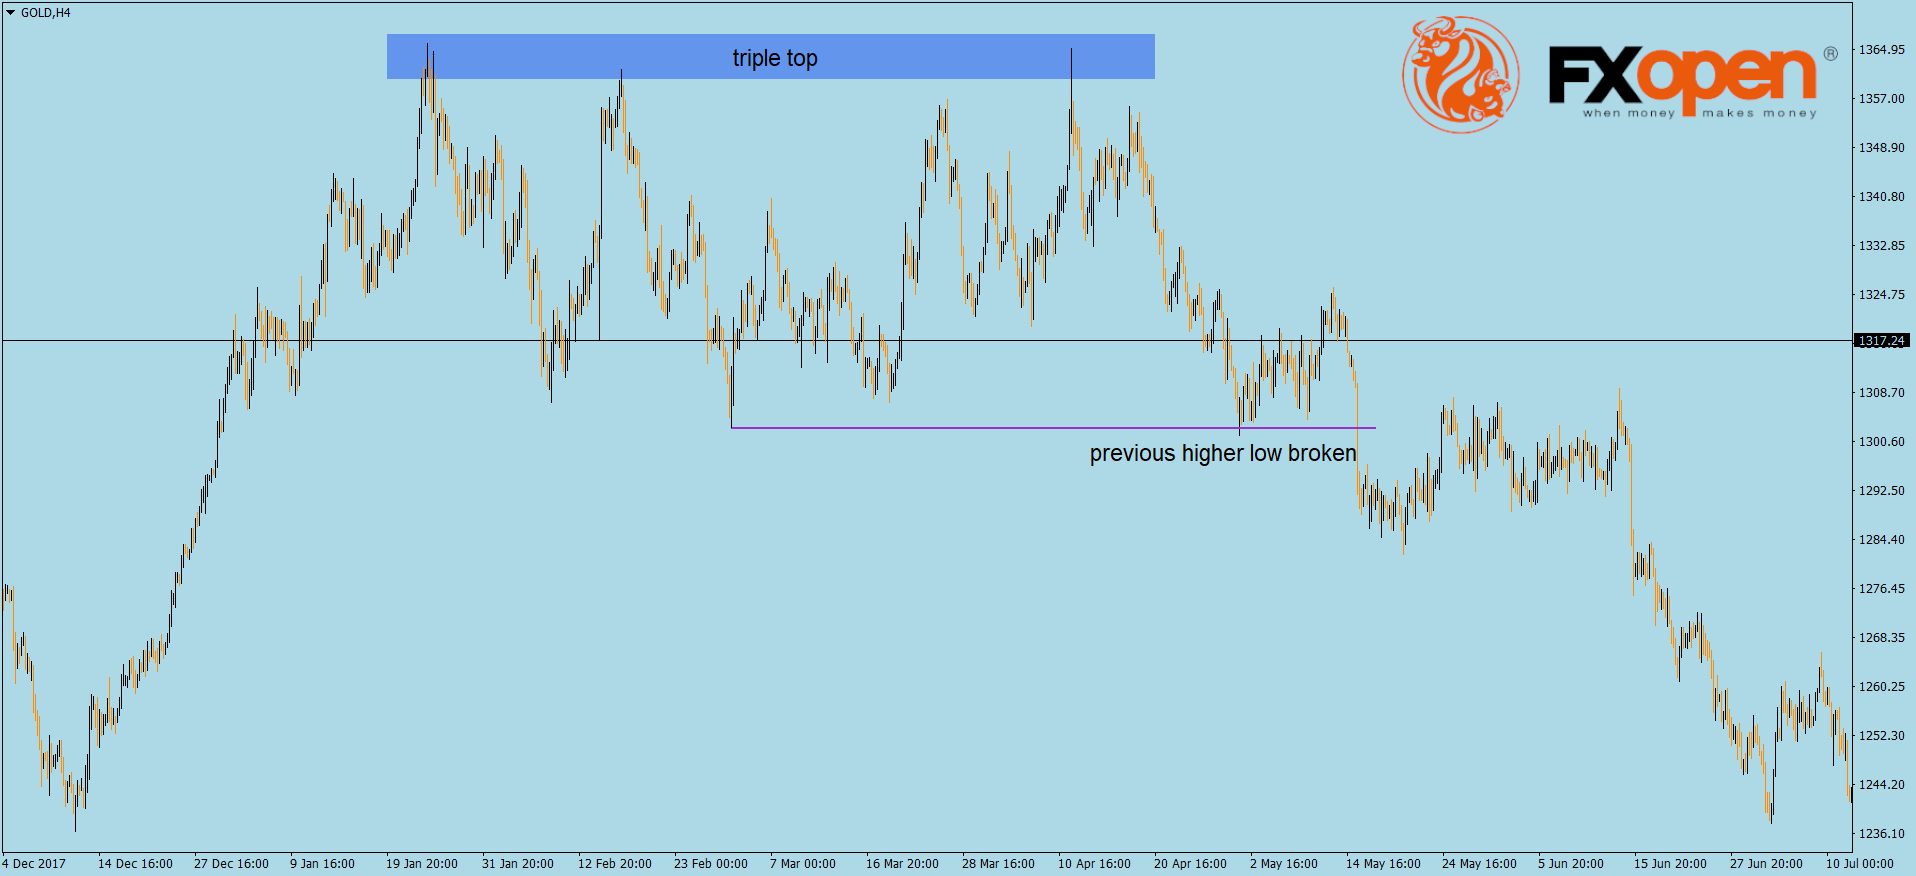
The focus shifts to the previous higher low. Assuming the market was in a bullish trend, the bearish sign, or the signal for the new trend is given when the price breaks that higher low.
With the previous higher low broken, it is time to define the new trend. For that, we take a trendline and connect the high in the triple top pattern with the first lower high following the bearish break.
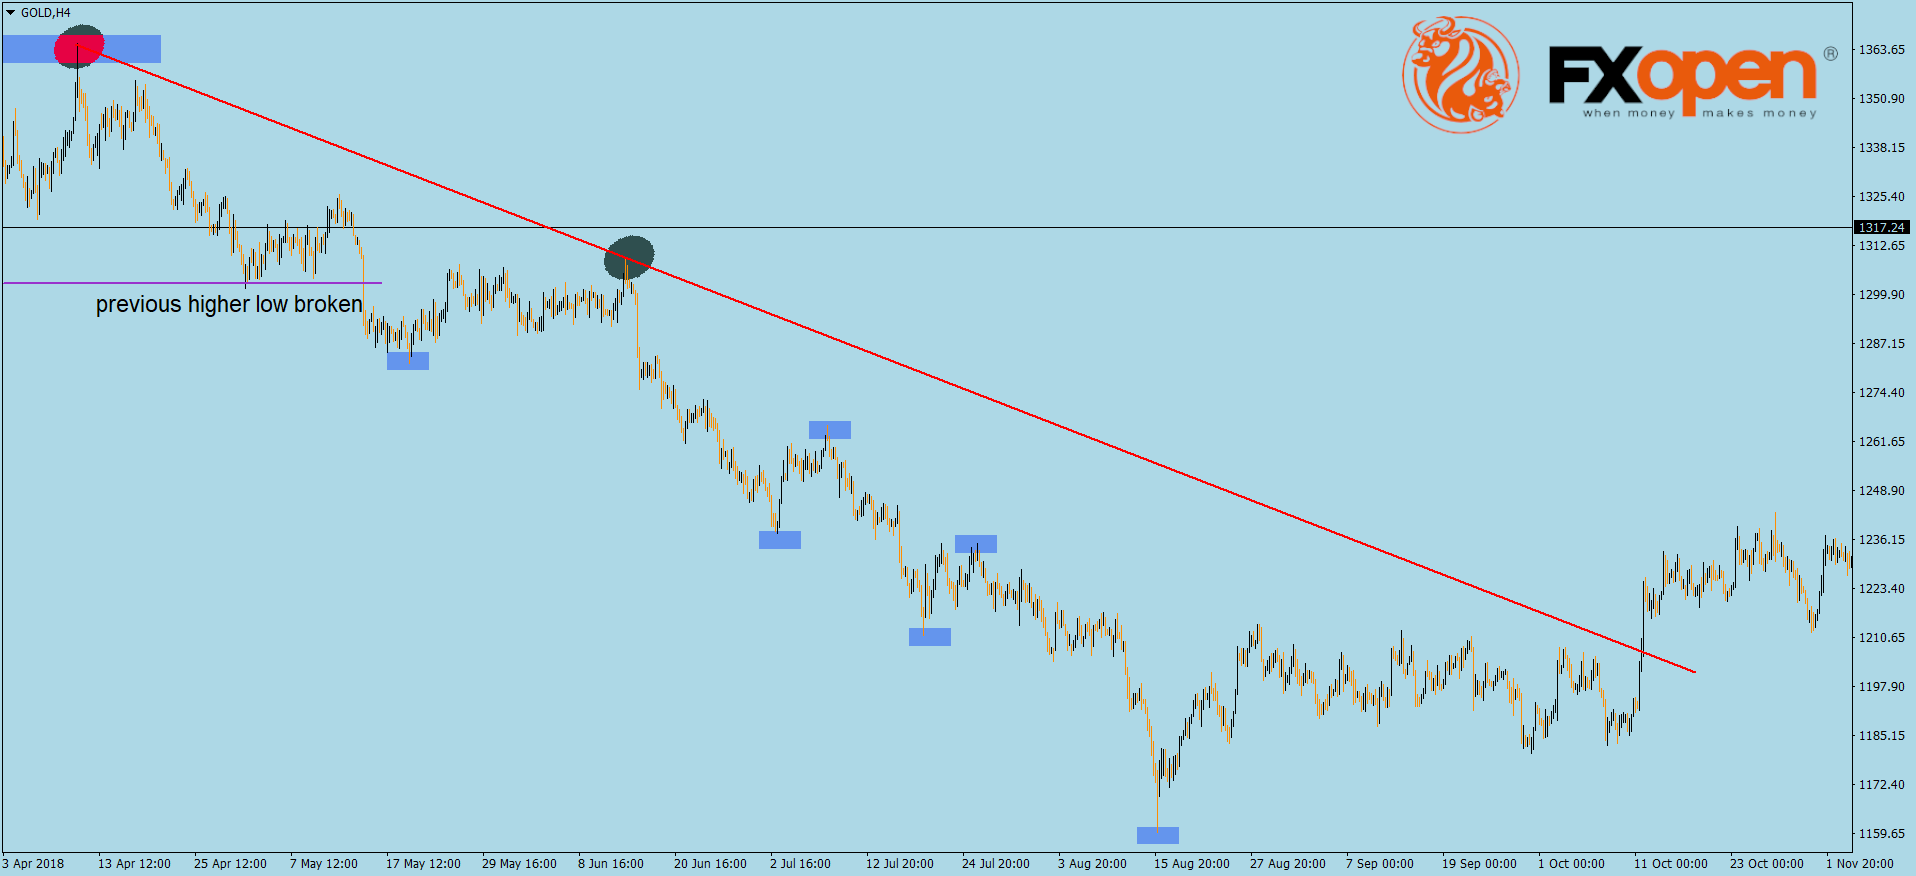
Dragging it to the right side of the screen, we see the benefit of a trendline. It clearly shows the bearish conditions. Buying until the price breaks it is riskier than staying on the short side.
The blue rectangles show the lower lows and lower highs series characteristic of a bearish trend. After the last lower low, the market took some time to consolidate. And finally, it broke the bearish trendline.
Remember its purpose? To keep the traders on the right side of the market.
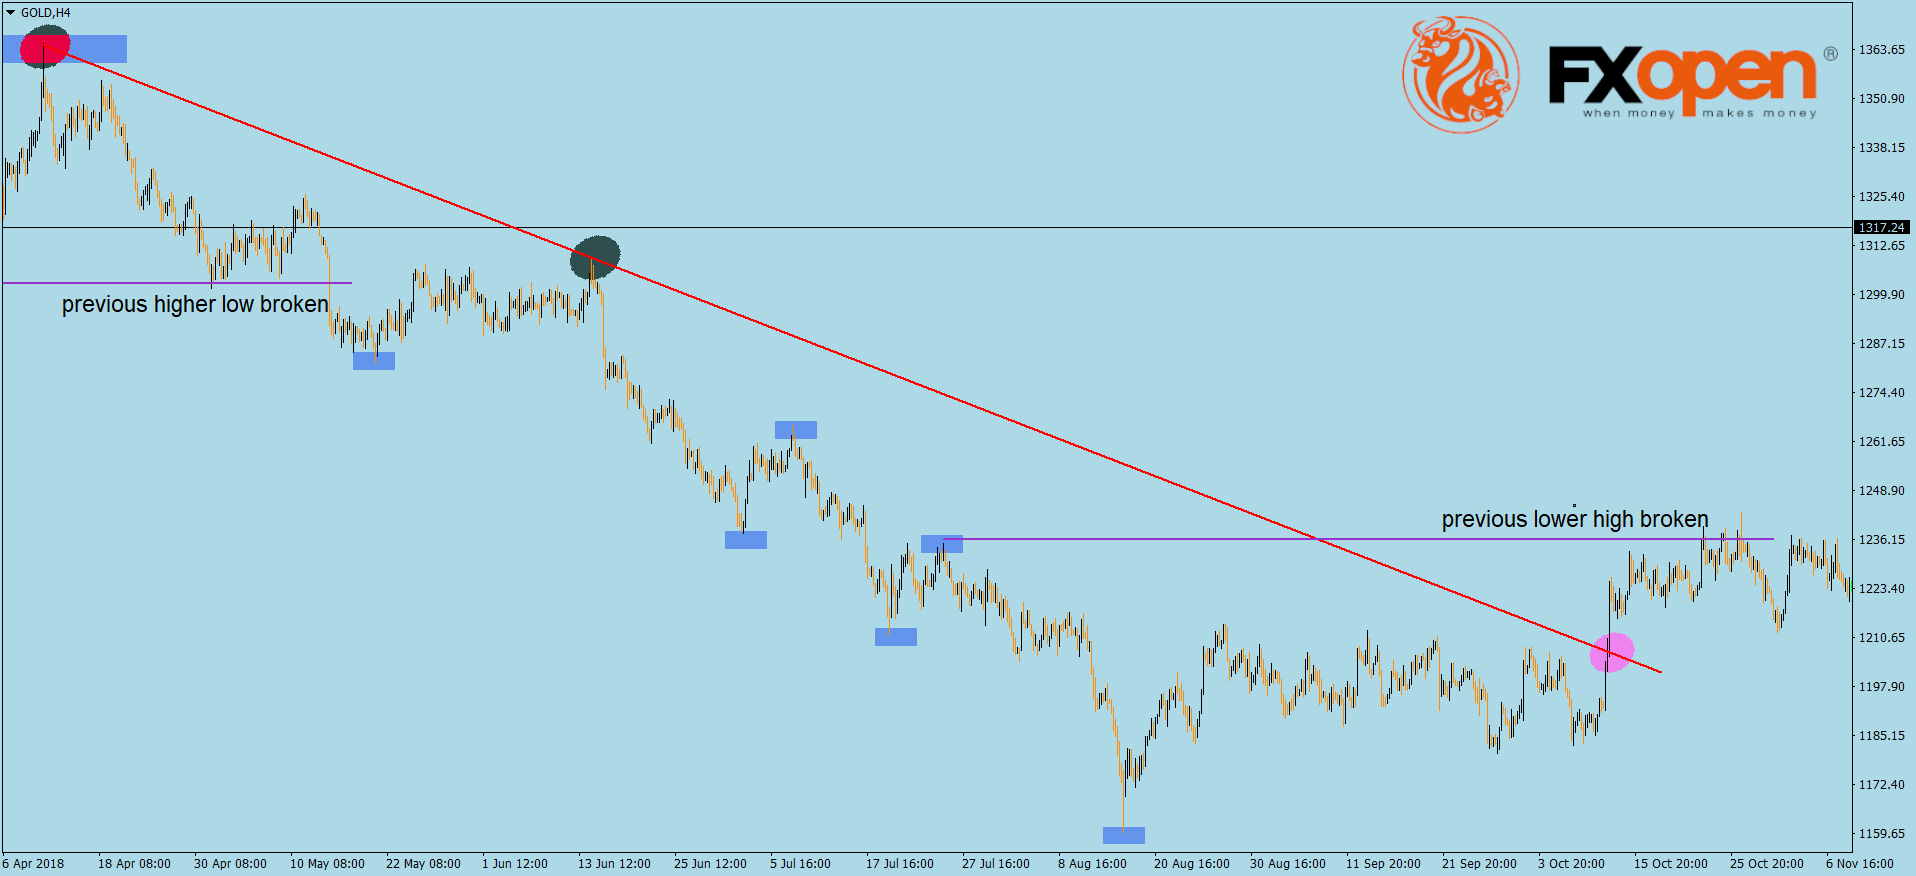
With the bearish trendline broken, traders apply the same rules but this time to trade a bullish trend. The first thing the price should do after breaking the trendline is also to break the previous lower high. It did, signaling the start of a bullish trend.
What did the price do? The chart below shows the importance of knowing how to ride a trend and the benefits of using its trendline.
Conclusion
As markets spend a lot of time consolidating, traders concentrate on finding conditions for possible trends. This article shows how to use the trendline and the series of lower lows and lower highs, respectively higher highs and higher lows. The rest is just money management and discipline
This article represents the opinion of the Companies operating under the FXOpen brand only. It is not to be construed as an offer, solicitation, or recommendation with respect to products and services provided by the Companies operating under the FXOpen brand, nor is it to be considered financial advice.
Latest articles

Anchored VWAP and How You Can Use It in Forex Trading
In the world of forex trading, understanding the nuanced tools at your disposal can significantly enhance decision-making processes. One such sophisticated tool is the Anchored Volume-Weighted Average Price (Anchored VWAP), which refines the standard VWAP by allowing traders to set

META Share Price Collapses after Publication of Quarterly Report
Just yesterday, META's stock price closed at USD 493.50, up approximately 40% since the start of 2024 and up nearly 300% since the start of 2023.
However, following the release of Meta's quarterly report, its shares plummeted to USD

USD/JPY Analysis: The Rate Exceeds The Level of 155 Yen Per US Dollar
Today, the price of USD/JPY once again renewed its 34-year high, exceeding the level of 155 yen per dollar, which put pressure on the current authorities.
According to Reuters, officials are trying to maintain calm in the market.
"We