


FXOpen

Moving Average is one of the most widely used tools in technical analysis. Although mostly traders have knowledge on what moving average is and how to use it but there are very few who actually know how to employ it for maximizing profits.
Basically moving averages give an average price of the underlying security over a period of time. Moving averages smooth out the market fluctuations and provide a filtered data. It helps in analyzing the price trend and gives even more reliable results when used in combination with other technical indicators.
Although it is a lagging indicator as it provides delayed signals i.e. a day or two after the market actually responds but still it can let you earn healthy profits.
Interpretation of Moving Averages
There are various techniques traders use to interpret the moving averages.
1. Comparing MA with the Price: The simplest interpretation involves comparing the moving average with the ongoing price of the security.
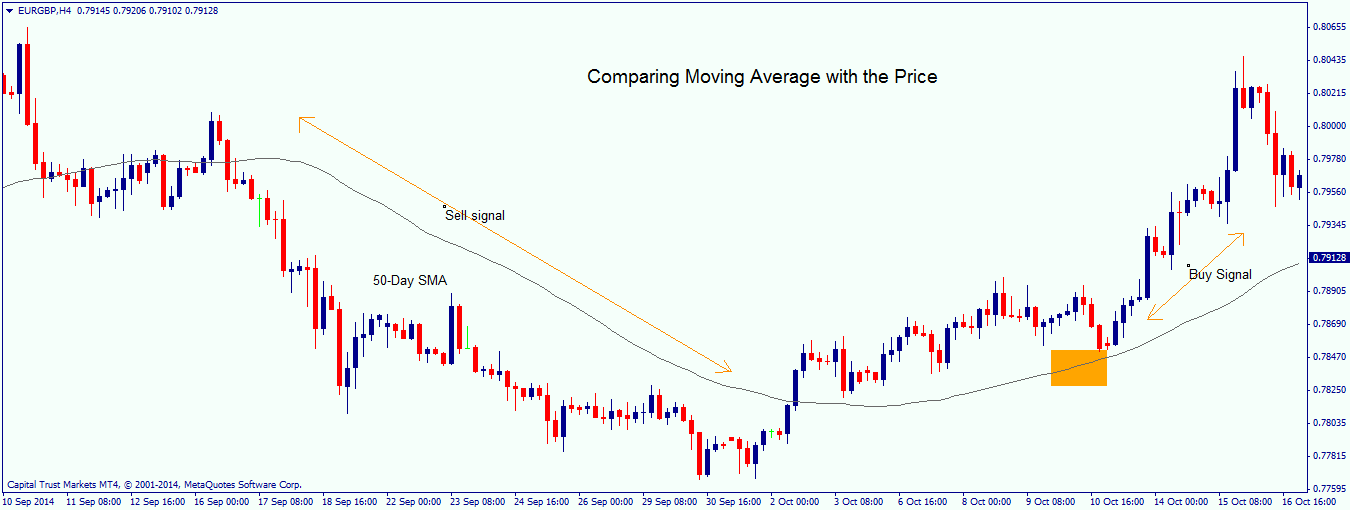
- A Buy signal is generated when the price is above the moving average.
- A Sell signal is generated when the price is below the moving average.
2. Using Two Moving Averages: This technique, also known as double cross-over, involves the use of two moving averages, one with a longer length and the other one with a shorter time period. This technique works well for the trending market.
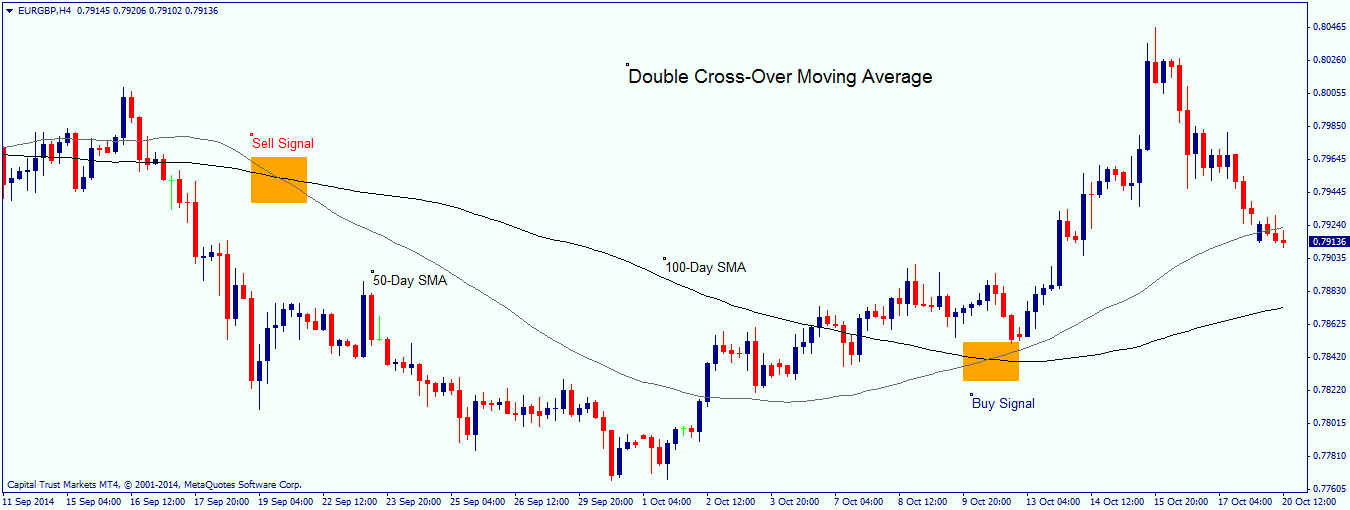
- A buy signal is there when the short-term MA crosses above the long-term MA, provided the long-term MA is rising. This is known as Golden Cross.
- A sell signal is there when the short-term MA crosses below the long-term MA provided the long-term MA is falling. This is known as dead cross.
Not to mention some traders also use triple crossover that involves the use of three moving averages.
This article represents the opinion of the Companies operating under the FXOpen brand only. It is not to be construed as an offer, solicitation, or recommendation with respect to products and services provided by the Companies operating under the FXOpen brand, nor is it to be considered financial advice.
Latest from Trader’s Tools
Latest articles
AUD/USD Rises Sharply on Inflation News
The Consumer Price Index for Australia was released this morning. According to ForexFactory:
→ CPI in quarterly terms: actual = 1.0%, expected = 0.8%, previous value = 0.6%;
→ CPI in annual terms: actual = 3.5%, expected = 3.4%, previous value = 3.

TSLA Share Price Up About 13% Despite Disappointing Report
Yesterday, TSLA trading closed at USD 144.68 per share, after which Tesla reported its results for the 1st quarter:
→ earnings per share: actual = USD 0.45, forecast = USD 0.49;
→ gross income: actual = USD 21.45 billion, forecast = USD

Market Analysis: Gold Price Corrects Gains While Oil Price Regains Strength
Gold price rallied above $2,400 before correcting lower. Crude oil price is rising and it could climb further higher toward the $85.50 resistance.
Important Takeaways for Gold and Oil Prices Analysis Today
· Gold price rallied significantly above $2,