


FXOpen

Today we are going to cover a breakout strategy using the Parabolic SAR indicator in conjunction with the MACD and the 200-day SMA (simple moving average) indicator. It’s executed solely on the H4 timeframe.
- 200-day SMA to define a trend. This works in the area of the price action relative to the indicator. If the price is lower than 200 SMA, this is an uptrend. If the price is higher than the 200SMA, this is a downtrend.
- The 13-day SMA, acting as short-term support that will serve for a long entry, or as a short-term resistance for a short trade entry.
- Color-coded MACD indicator: Again as with other strategies, a red color connotes a bearish bias, while a blue color shows a bullish bias. A switch in color during an active trade is an indication that the bias has shifted and this should be taken as a signal to exit the trade.
- Parabolic SAR indicator is usually used with its default settings. The most important thing to note with the indicator is that when the indicator stars are found above the candlesticks, the trend for the trade is bearish. When found below the candlesticks, the trend would be bullish. Moreover, a switch in location of the indicator relative to the candlesticks can be taken as a signal to exit an open trade. These factors will be utilized in the course of describing the strategy.
Parabolic SAR Strategy: Short Trade
For a short trade, look for an entry if the following setup is seen:
- Price action located below the 200SMA.
- Price action retreats off the 13 SMA, or is resisted at the 13 SMA line.
- Parabolic SAR indicator is found above the candlesticks.
- MACD histogram is red in color.
Considering all these signals, the short trade can be initiated at the point where the price action is resisted at 13SMA, i.e. the price doesn’t break above the 13 SMA.
You can see the example of the short entry setup below.
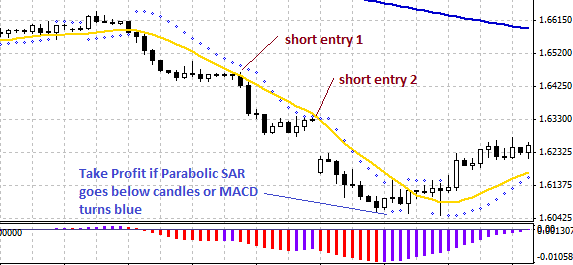
In this chart, there are two potential points to enter the trade. The second entry point is valid as the Parabolic SAR and MACD indicators are still demonstrating bearish trend.
The stop loss for the trade is located above 13 SMA, and the Take Profit is left with dynamic levels. In this case, a reversal of the Parabolic SAR and MACD indicators should inform the trader to exit the trade.
Parabolic SAR Strategy: Long Trade
The long trade is a reversal of the short trade. Here the trader should look out for the following setup:
- Price is above the 200 SMA line. This imparts an uptrend.
- Price bounces up from the 13SMA.
- Parabolic SAR indicator appears below the candlesticks.
- MACD histogram is blue.
The signals inform of a bullish trend. The long trade should be initiated when the price bounces off the 13SMA line i.e. the price does not break out the 13 SMA. You can see the setup in the chart below:
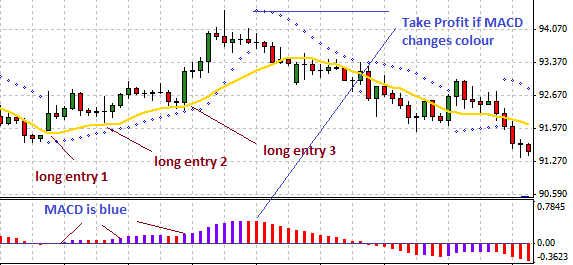
Here, it’s clearly seen that there were three potential entry points along the line of the 13SMA, while the price was above the 200 SMA and the MACD was blue in color. For this trade, we should set the stop loss below the 13SMA and the take profit – at the point where the MACD has turned red or the Parabolic SAR is above the price action.
Conclusion
Entry trades should be initiated with market orders. The price action determines the shape of the 13SMA indicator, so it’s not possible to apply a fixed entry system such as the limit orders to set a trade.
It should also be considered that there are times when the price action may not trend very well, but moves sideways. The use of a 4-hour chart will, therefore, ensure that even when prices are flat, at least 30 pips can be made from each trade. When prices are trending, the average performance of a trade averages 120 pips. So plenty of money can be made from a perfect trade setup.
This article represents the opinion of the Companies operating under the FXOpen brand only. It is not to be construed as an offer, solicitation, or recommendation with respect to products and services provided by the Companies operating under the FXOpen brand, nor is it to be considered financial advice.
Latest articles

Weekly Market Wrap With Gary Thomson: UK100, USD, GOLD, OIL
Get the latest scoop on the week's hottest headlines, all in one convenient video. Join Gary Thomson, the COO of FXOpen UK, as he breaks down the most significant news reports and shares his expert insights.
- UK100 Share Index Rises

What Is a Darvas Box Theory and How Does It Work in Trading?
The Darvas Box Theory, pioneered by Nicolas Darvas in the 1950s, has transcended its stock market origins to become a valuable tool for forex traders. This method leverages specific price movements and patterns, known as the Darvas Box, to track

NFLX Stock Price Falls Despite Subscriber Growth
Yesterday, after the close of the main trading session on the stock market, Netflix reported to investors for the 1st quarter of 2024.
The report turned out better than expected:
→ earnings per share: actual = USD 5.28, forecast = USD 4.