


FXOpen

General view and macroeconomic data:
It appears that markets are disappointed with recovery in the US while EU data seem stable despite soft ZEW economic sentiment recent readings. Therefore USD/JPY stays on the back foot while Cable and EUR/USD are trying to regain balance.
Markets are awaiting ECB meeting scheduled on June 5th when ECB will decide whether to ease further (cut rates, introduce unconventional monetary measures) or not. Last week’s EMU CPI readings came same as previous numbers what was widely expected – that didn’t help speculators. Meanwhile US data is still mixed
with soft industrial production and capacity utilization readings and positive unemployment claims and CPI figures.
This week we have inflation data from UK on Tuesday and Bank of England minutes on Wednesday. Moreover FOMC will publish its minutes along with Janet Yellen’s speech also on Wednesday. These data and Thursday’s PMI readings will most probably have significant impact on market as they touch most important of investors’ concerns – EMU recovery, US monetary policy and UK/BoE rates path.
EUR/USD consolidates in tight range
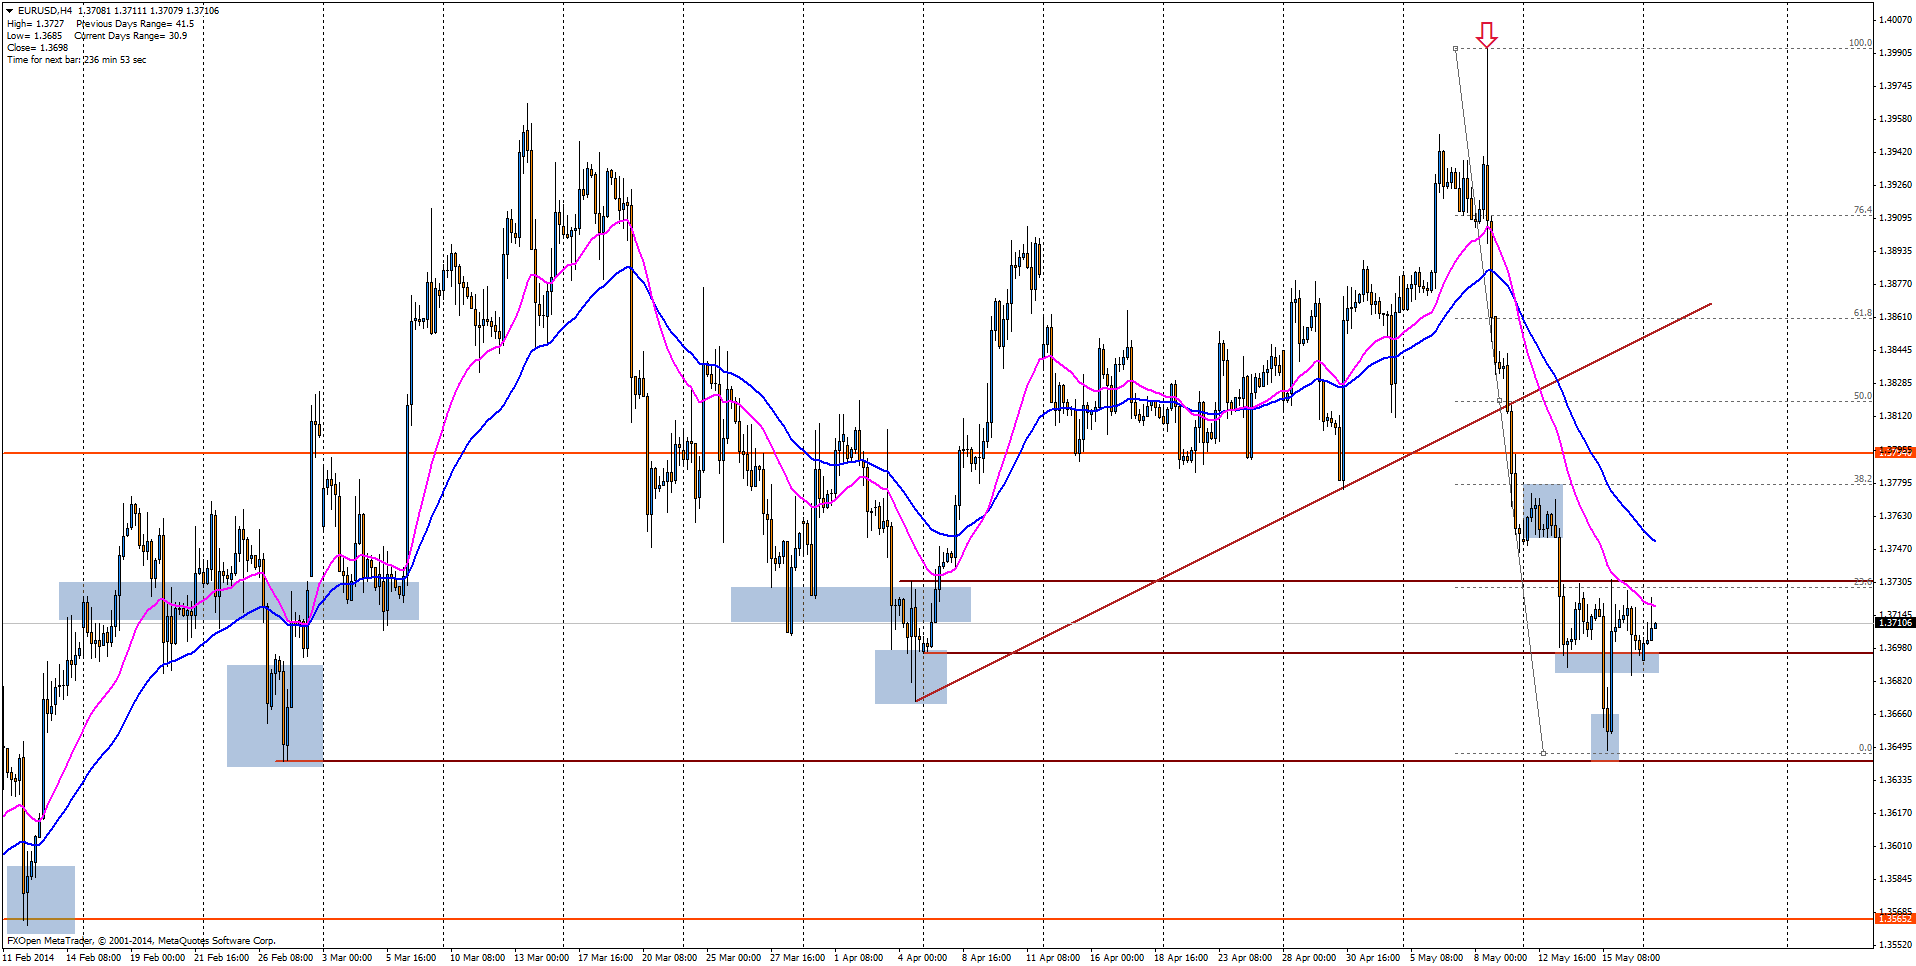
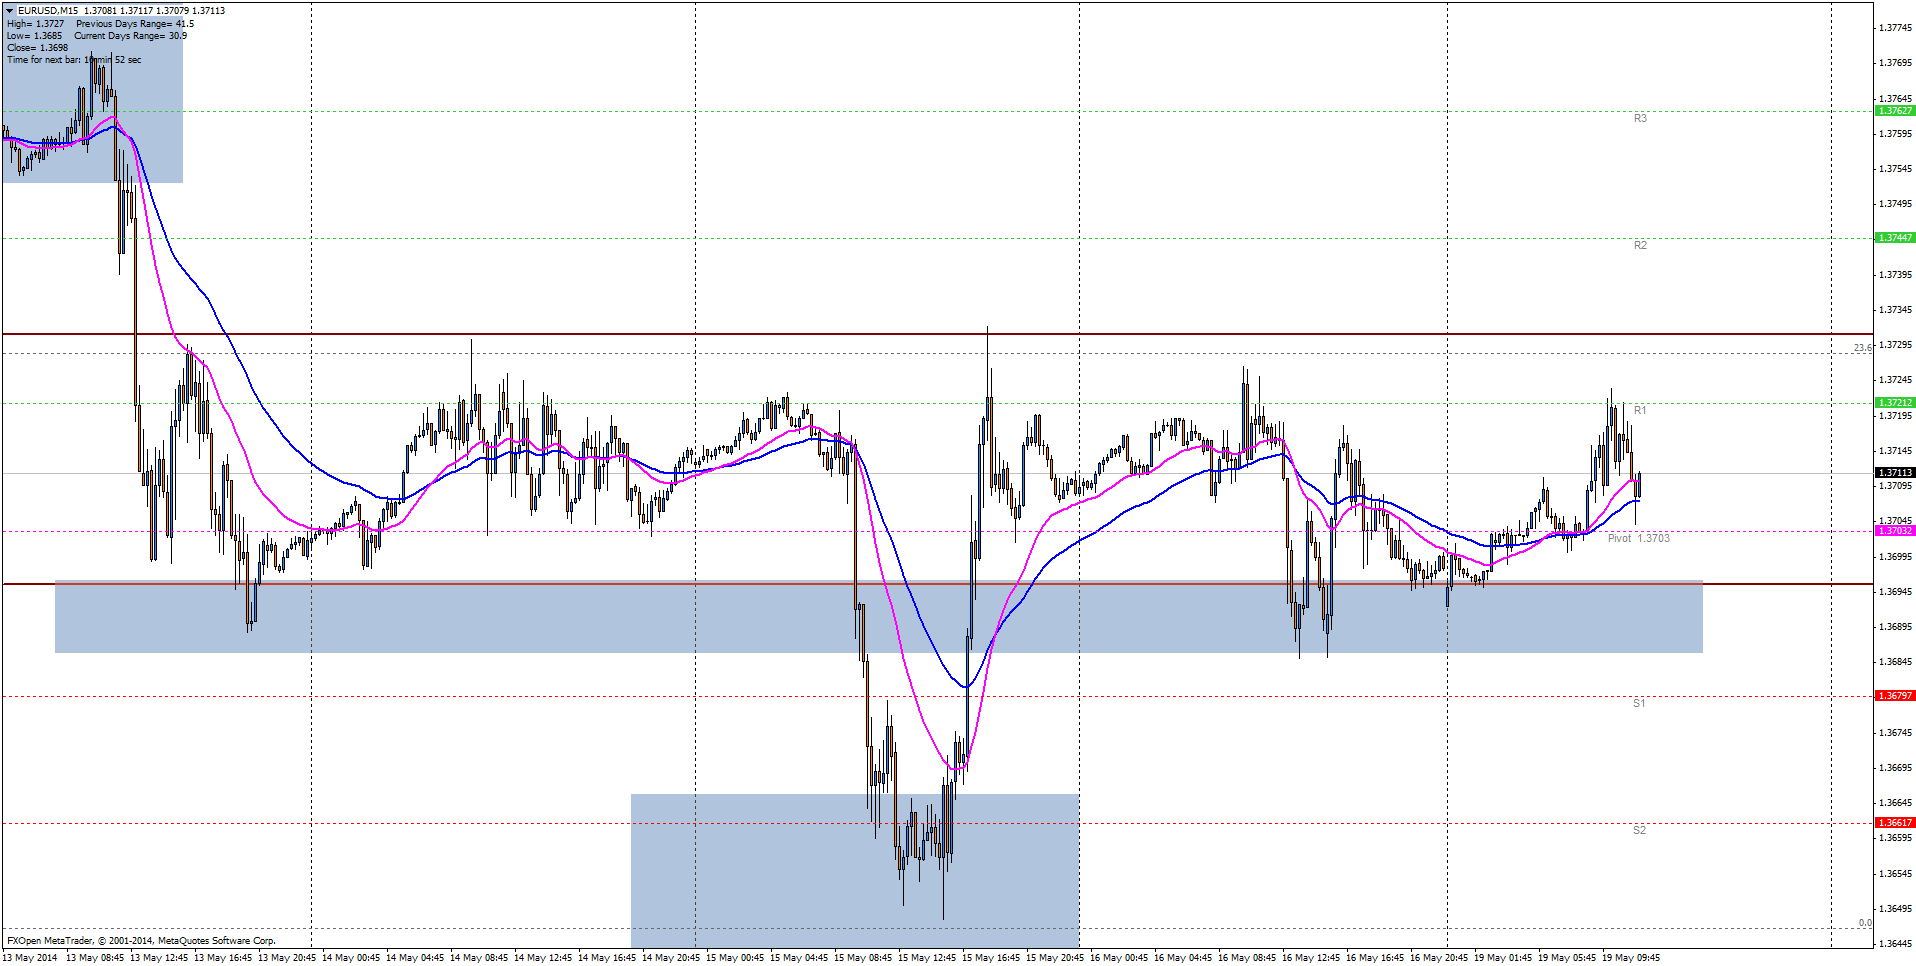
After big drop from 1.4000 two weeks ago, pair hit 1.3650 last Thursday where it found plenty of buyers. Demand was strong enough to lift price into 1.3690 – 1.3730 range and keep it there till end of last week. After 350 pips fall, markets are starting to speculate about possible retracement but concerns about possible monetary easing from ECB would probably keep price capped until bank’s decision on June 5th.
Trade ideas: Technically pair could be played similar as range. Sell upper bound and buy lower. Meanwhile fundamental traders might be interested only in short traders.
Current Support/Resistance levels
- 1.3820/1.3790 – couple weeks’ low, round level, good supply area, 50% Fibonacci Retracement
- 1.3760/70 – last week’s high, local supply area, 38.2% Fibonacci Retracement
- 1.3730 – local resistance level, couple days’ high
- 1.3700/1.3690 – support area from Thursday’s buying, couple day’s low, round level.
- 1.3650 – February 27th low, decent demand area from last week, price rallied from it after testing.
- 1.3570 – Feb 12th low, next key level for bulls to defend with 1.3600 round level above.
EUR/USD 4-hour | Click to enlarge
EUR/USD 15-minutes | Click to enlarge
GBP/USD found balance?
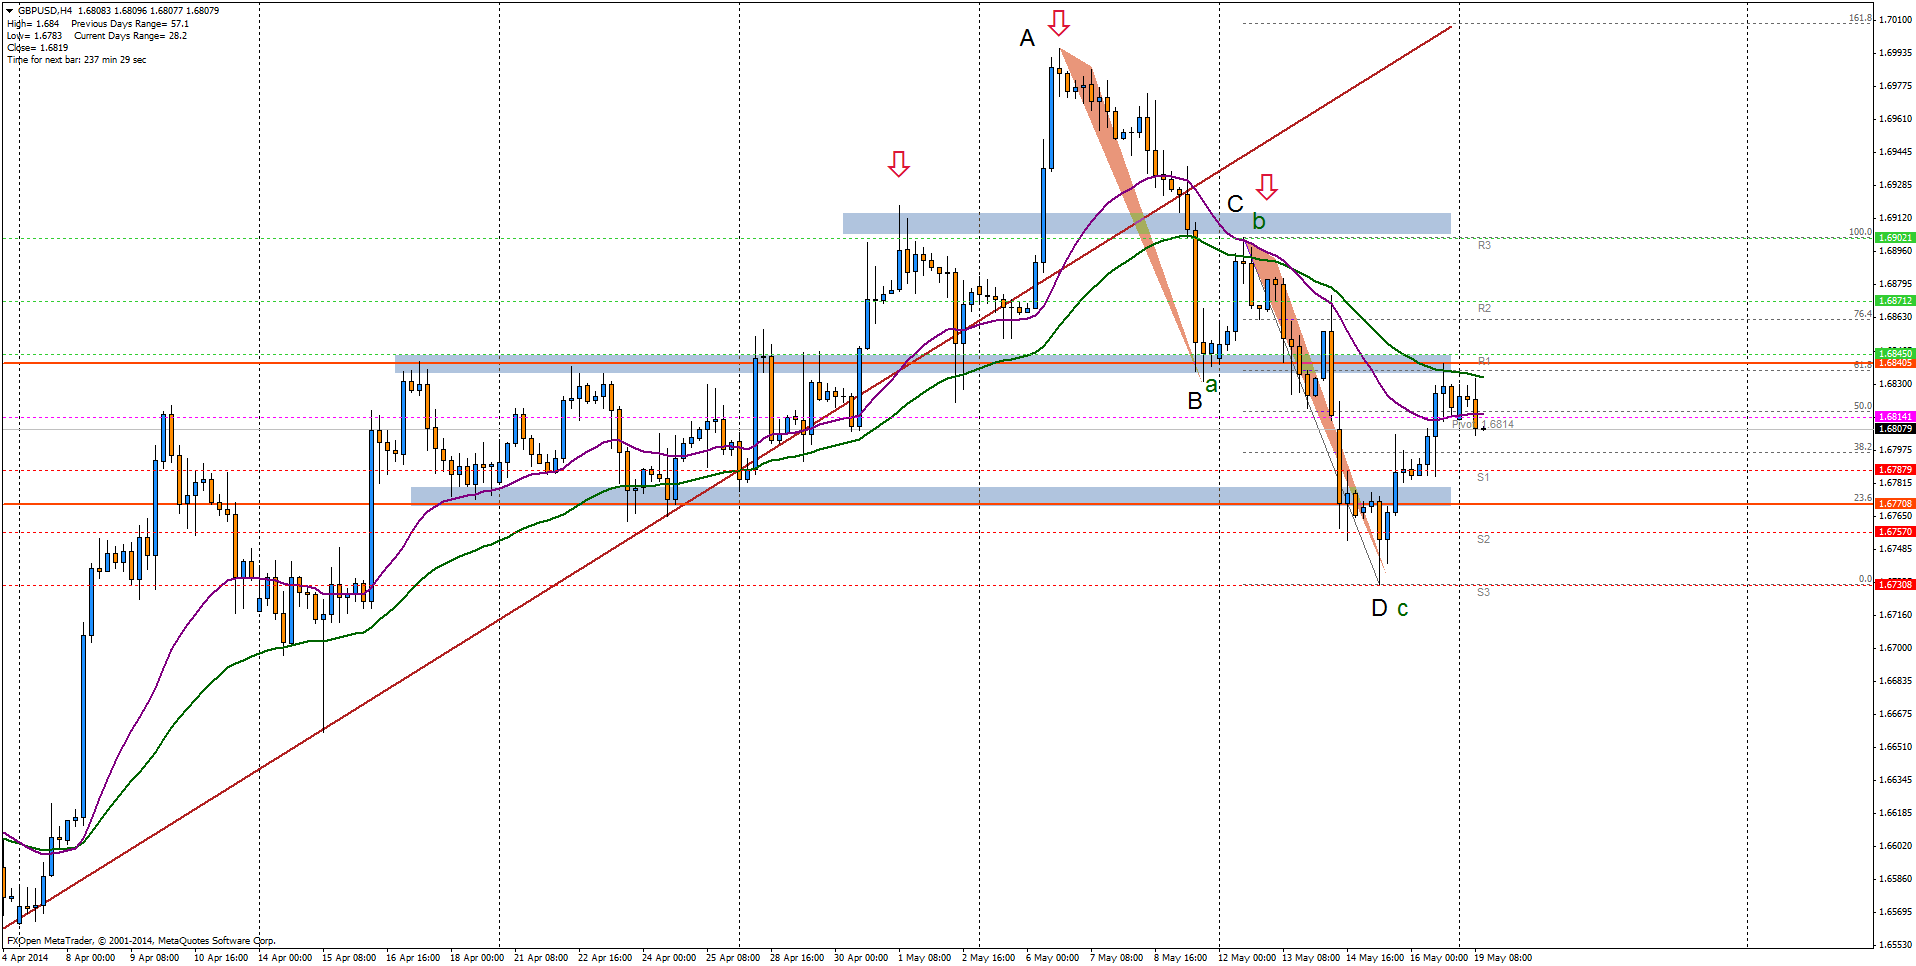
Cable has been sold two weeks straight but then it found some buyers on Friday last week and got back very close to last week’s open at 1.6840.
In my Cable analysis last week I mentioned possible SHS pattern which range is now fulfilled as well as ‘abc’ retracement pattern and AB=CD harmonic pattern. Adding decent support 1.6800 – 1.6770 which has been successfully defended to the whole picture we receive image of possible resume of an uptrend.
But also bears have something interesting. Last two weeks are bearish candles forming a reversal pattern so possibly for them, the downward move is not finished yet. Also, last significant peak 1.6870 stays still untouched.
Trading ideas: “Buy low, sell high” whether you are bull or bear, you might consider selling one of key resistance areas:
- 1.6900 – last week’s high, round level
- 1.6870 – Wednesday May 14th high, supply area, descending trendline, 76.4% Fibonacci Retracement of last week’s range.
- 1.6840/50 – week before low, 61.8% Fibonacci retracement.
Support areas that might bounce the price are:
- 1.6770 – April 23rd low, 23.6% retracement
- 1.6730 – last week’s low, potential double bottom pattern.
- 1.6730 – 1.6700 – strong demand area from April, Daily Moving Average for 55 periods.
GBP/USD 4-hour | Click to enlarge
USD/JPY falling down from stairs
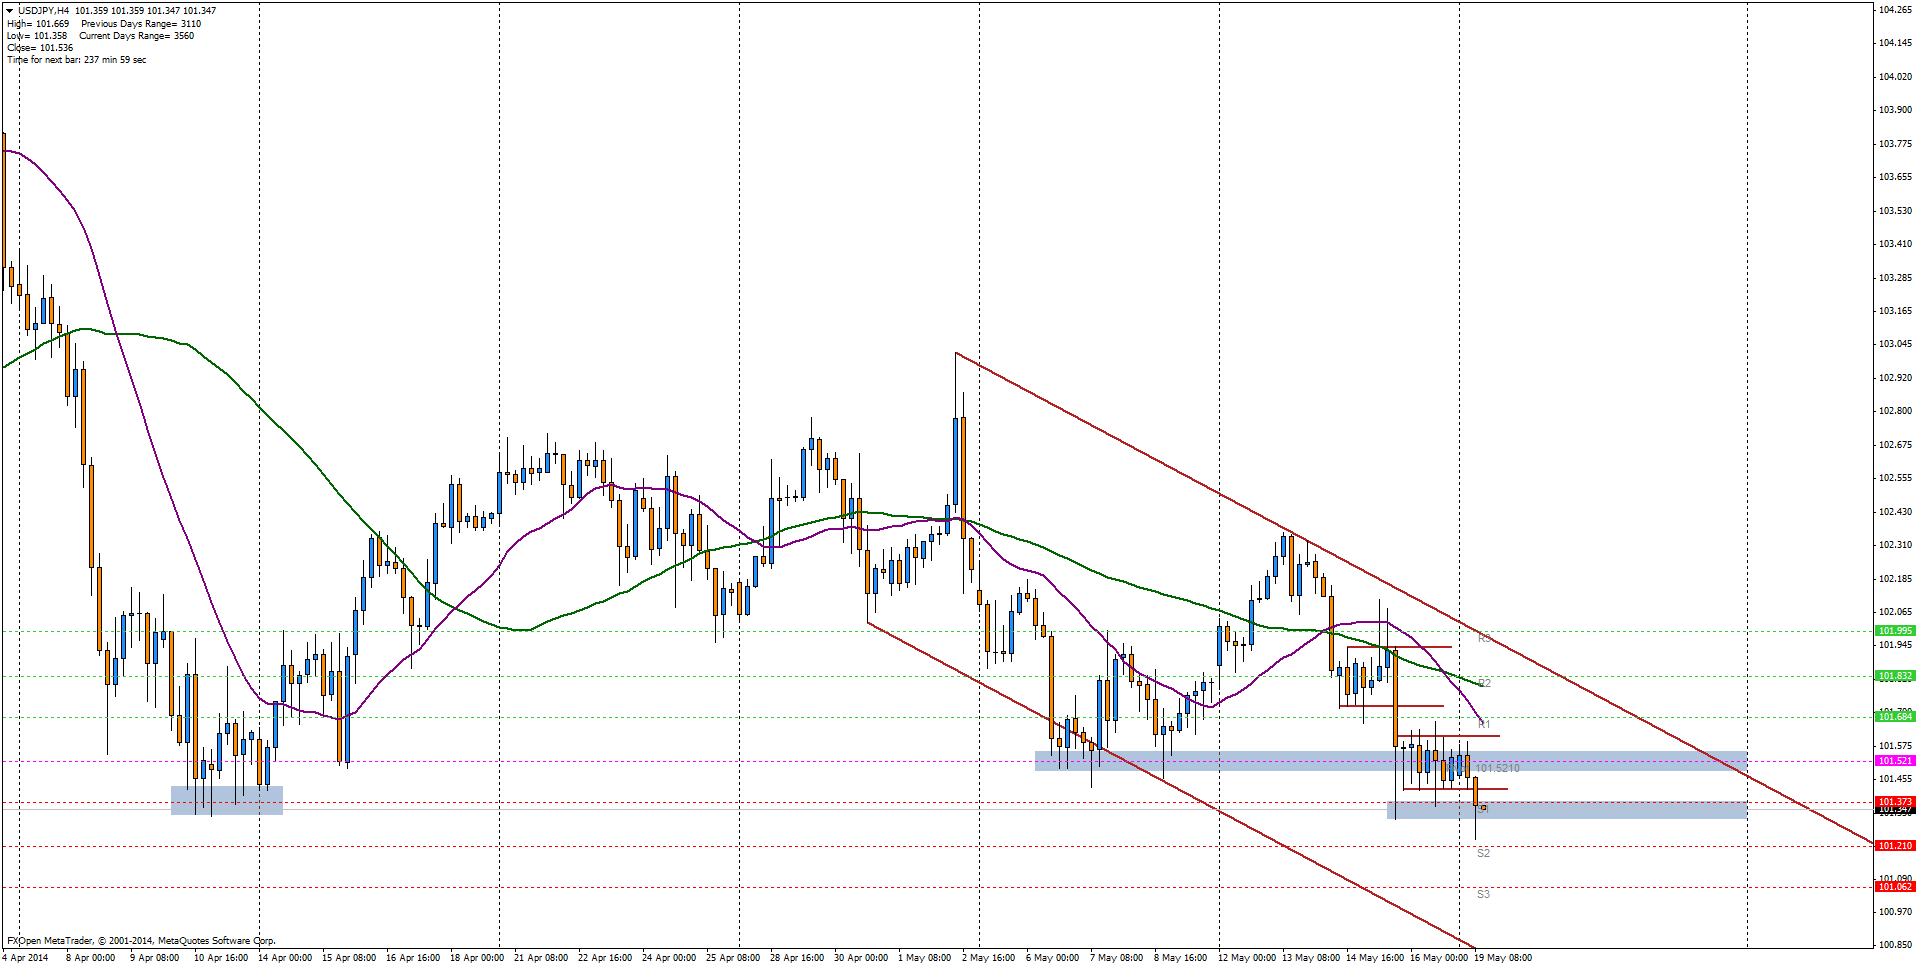
Yen is down 100 pips from last week’s high at 102.30 and downward move is shaped in stairs pattern showing flat retracements – this proves weak demand. Now price is testing 101.30/101.00 key area from which price may drop another 100 pips or even 300 pips to the next significant level.
After last week’s US data, recent disappointment with slower recovery in US than was anticipated, concerns about Chinese slowdown and financial sector condition, USD/JPY has a hard time while Tsys yields are falling down. Break from 101.00 to the downside may target:
- 100.00 – support from November and September 2013, Fibonacci Retracement 61.8% of October to December 2013 rally.
- 99.00/98.70 – demand area from October and November 2013, Fibonacci Retracement 76.4%
- 97.60 – November ’13 low.
Breaking below 100.00 would be significant for the pair while big banks are still recommending buying USD/JPY and many projections consider 108 and 110 to be reached during 2014. Concluding, the lower we are on Yen, the bigger fear and disappointment.
From above we have couple retracement significant levels that remain unchanged from some time:
- 102.00/30 – last week’s high, Fibonacci Retracement 38.2%
- 102.70/103.00 – February peak and local high on April
- 103.30 – Fibonacci Retracement 23.6%, resistance near March high.
USD/JPY 4-hour | Click to enlarge

USD/JPY daily | Click to enlarge.
Trade over 50 forex markets 24 hours a day with FXOpen. Take advantage of low commissions, deep liquidity, and spreads from 0.0 pips. Open your FXOpen account now or learn more about trading forex with FXOpen.
This article represents the opinion of the Companies operating under the FXOpen brand only. It is not to be construed as an offer, solicitation, or recommendation with respect to products and services provided by the Companies operating under the FXOpen brand, nor is it to be considered financial advice.
Latest from Forex Analysis
Latest articles

What Is a Darvas Box Theory and How Does It Work in Trading?
The Darvas Box Theory, pioneered by Nicolas Darvas in the 1950s, has transcended its stock market origins to become a valuable tool for forex traders. This method leverages specific price movements and patterns, known as the Darvas Box, to track

NFLX Stock Price Falls Despite Subscriber Growth
Yesterday, after the close of the main trading session on the stock market, Netflix reported to investors for the 1st quarter of 2024.
The report turned out better than expected:
→ earnings per share: actual = USD 5.28, forecast = USD 4.

Escalation Between Iran and Israel: How the Price of Brent Oil Reacts
On the night of Thursday into Friday, reports emerged that Israel had attacked Iran following Iran's attack on Israel over the weekend.
Let's remember that we wrote on Monday that after a 300 drone and missile attack on Israel over