


FXOpen
LTC/USD
The price of Litecoin has fallen by 16.34% from yesterday’s high at $51.38 and is currently being traded at $42.8.
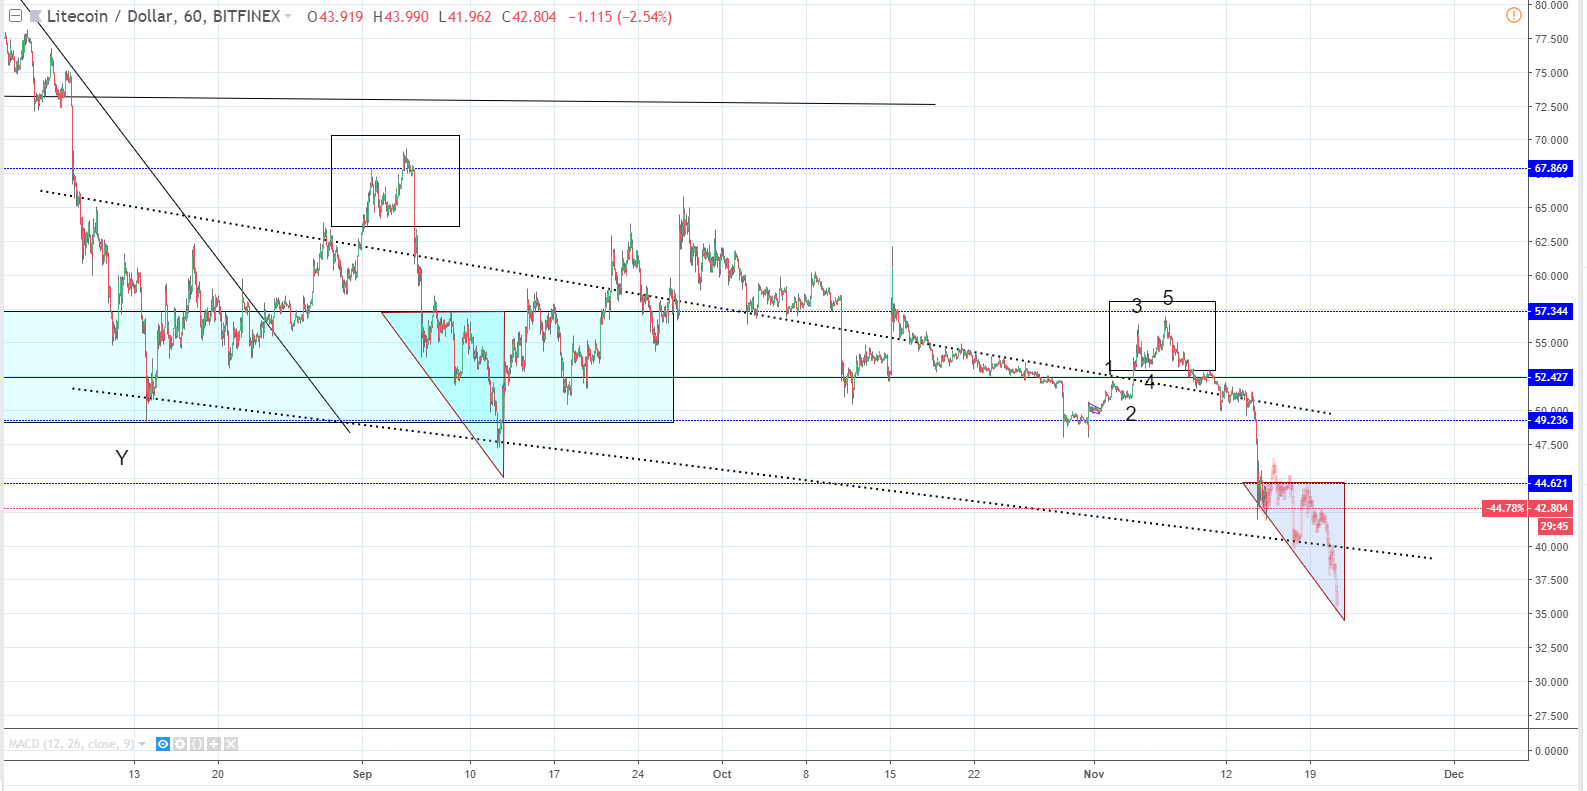
Looking at the hourly chart, we can see that the price fell through the descending channels resistance with a massive momentum as the majority of the decline happened in only 8 hours. Currently, the price is below the S2 support line at $44.621. I’ve labeled as a support zone forming a cluster around those levels. The wicks from the downside are indicating that some support has been found but I believe that it will hold only temporary.
As you can see, I have labeled some fractals. One being the top formation is labeled with a rectangle, and the other one is my project scenario based on the prior scenario. As I am expecting that the price falls further, at least to the descending channel’s support line, this projection looks very likely. Last time when the price behaved like this, we saw more downfall but with more consolidations in between. I believe the same will happen now as well.
Zooming out on to the daily chart, you can see that the projected ghost bar pattern lands on the next significant horizontal support level at $38.21.
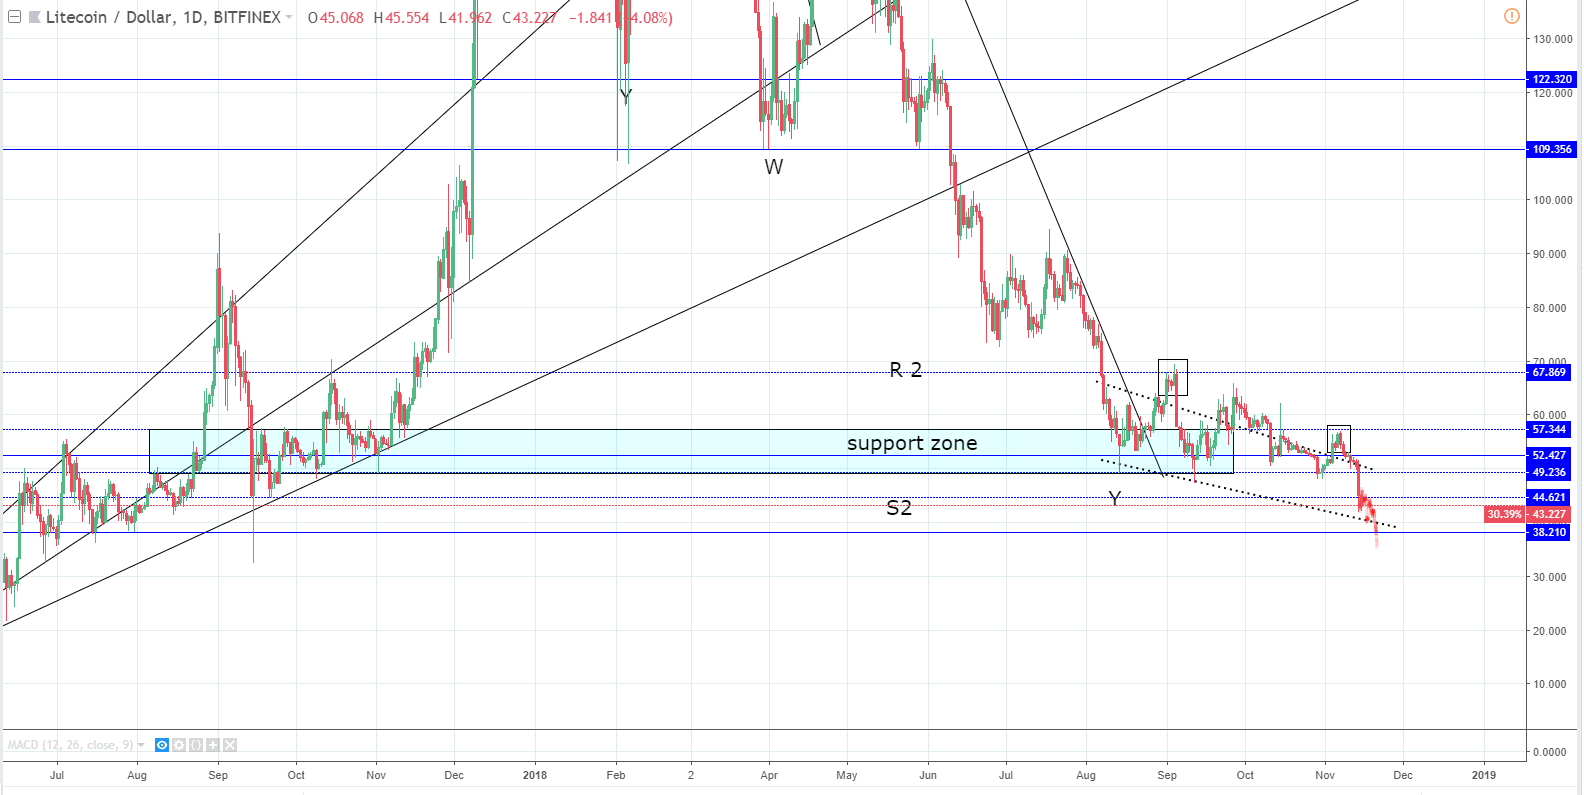
As the price is below S2 and has managed to stay there for some time, we can say that a breakout from the support zone occurred. As you can see prior to this downfall, the price managed to stay above the median line of the support zone for the most part. Now, when the price is below its last accountable reaching level and considering the powerful momentum behind the move, I think that it’s very likely that the price may fall to $38.21 level where it will find support.
EOS/USD
The price of EOS has fallen by 14.89% from yesterday’s high at $5.348 and is currently being traded at $4.5412.

Looking at the hourly chart, we can see that the price has fallen as the minor WXYXZ ended on the significant horizontal level at $5.84, which served as resistance to the next horizontal level, which serves as support at $4.589. Now, when the price has fallen steeply and aggressively we are likely going to see some consolidation around the support level as the price has already fallen below. It was previously forming a cluster putting pressure on the level.
Zooming out to the daily chart, you can see my Elliott Wave labelings. They point out that the price is heading down much further. This symmetrical triangle seen on the hourly chart was only a bearish pennant in which the correction in the opposite direction occurred. The price has broken out from that structure now and started another potentially impulsive move to the downside.
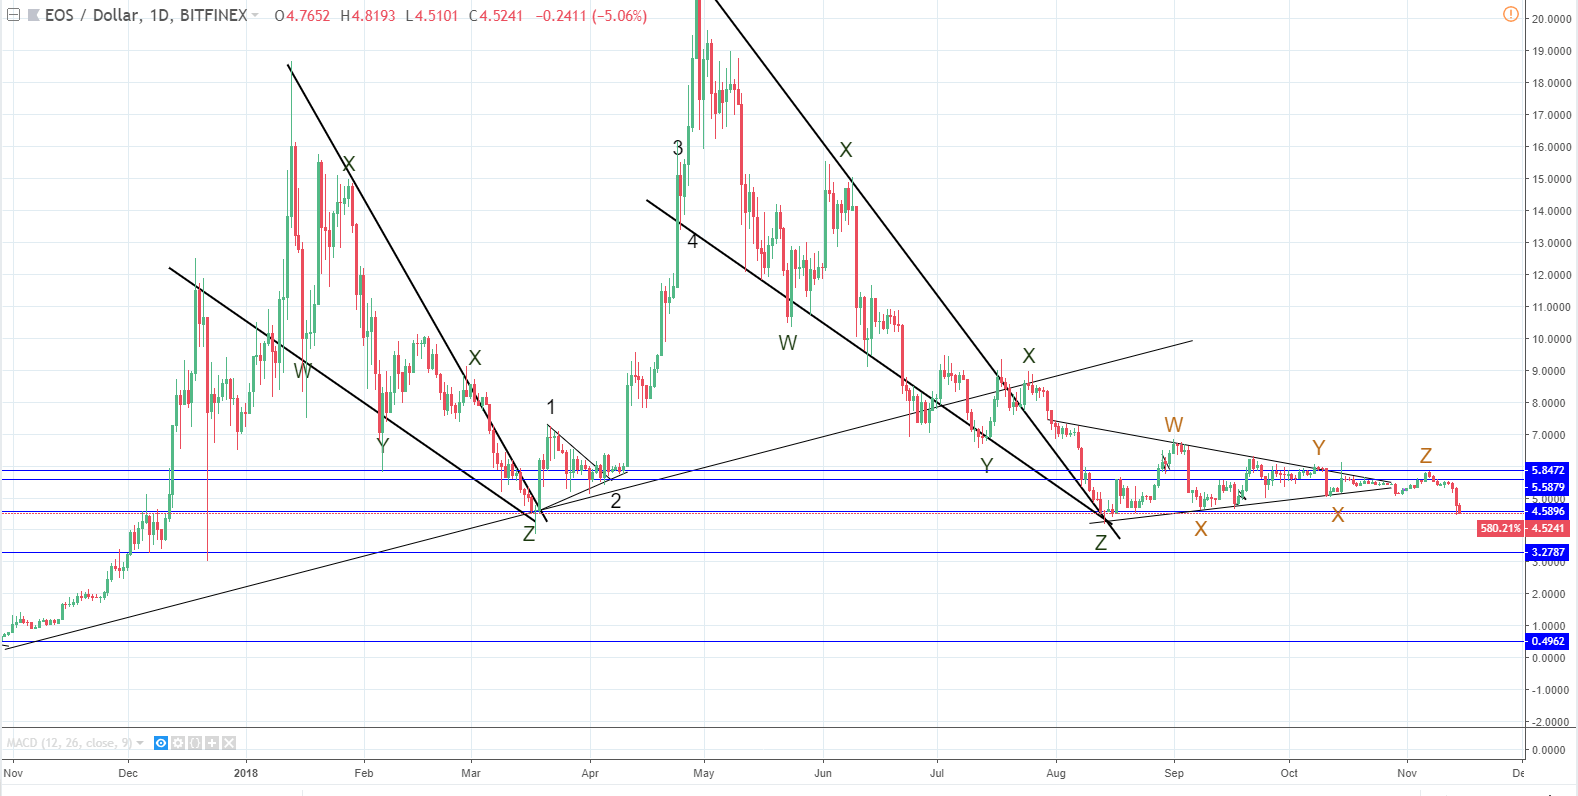
If the EOS/USD pair breaks the current support level (and the price has already been below it on the last Z wave and is currently below it), the next strong enough horizontal support level is at 3.27$.
FXOpen offers the world's most popular cryptocurrency CFDs*, including Bitcoin and Ethereum. Floating spreads, 1:2 leverage — at your service. Open your trading account now or learn more about crypto CFD trading with FXOpen.
*At FXOpen UK and FXOpen AU, Cryptocurrency CFDs are only available for trading by those clients categorised as Professional clients under FCA Rules and Professional clients under ASIC Rules respectively. They are not available for trading by Retail clients.
This article represents the opinion of the Companies operating under the FXOpen brand only. It is not to be construed as an offer, solicitation, or recommendation with respect to products and services provided by the Companies operating under the FXOpen brand, nor is it to be considered financial advice.
Latest articles

Anchored VWAP and How You Can Use It in Forex Trading
In the world of forex trading, understanding the nuanced tools at your disposal can significantly enhance decision-making processes. One such sophisticated tool is the Anchored Volume-Weighted Average Price (Anchored VWAP), which refines the standard VWAP by allowing traders to set

META Share Price Collapses after Publication of Quarterly Report
Just yesterday, META's stock price closed at USD 493.50, up approximately 40% since the start of 2024 and up nearly 300% since the start of 2023.
However, following the release of Meta's quarterly report, its shares plummeted to USD

USD/JPY Analysis: The Rate Exceeds The Level of 155 Yen Per US Dollar
Today, the price of USD/JPY once again renewed its 34-year high, exceeding the level of 155 yen per dollar, which put pressure on the current authorities.
According to Reuters, officials are trying to maintain calm in the market.
"We