


FXOpen

LTC/USD
Last Thursday the price of Litecoin was sitting at its lowest levels the price has been since 29th of April as it was $71.1 but from there started recovering until Monday when it came up to $78.87 at its highest. From Monday we’ve seen another decrease with the price making a slightly lower low compared to the last week’s one but is currently sitting at $73.867.
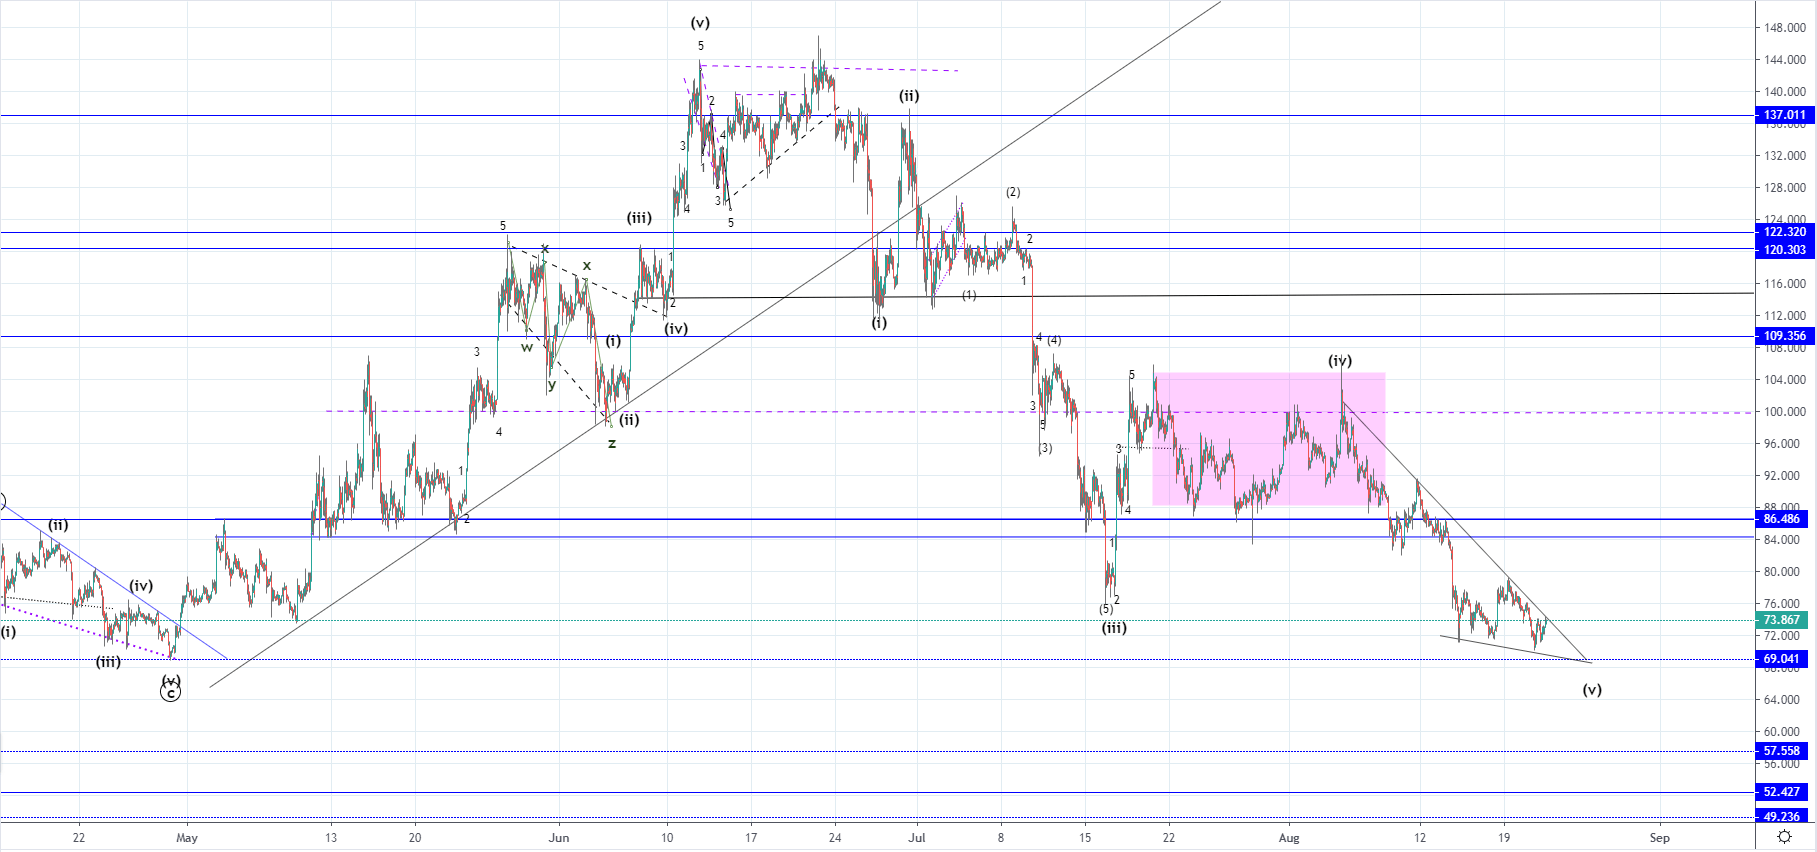 Looking at the hourly chart, you can see that the price almost came down to $69 horizontal level which is the support level of the starting point on the previous increase. If that previous increase was the 5th wave from the higher degree uptrend move this means that price has almost retraced to the 4th wave’s ending point. As we are seeing the development of the triangle structure and the price is now retesting its resistance level another rejection might likely occur with the price getting down again for proper interaction with the mentioned horizontal level.
This interaction would be expected to end as a test of the level for support and considering that the wave structure implies that we are seeing the ending wave out of the last downside move this is likely to end as a bounce from the horizontal level with the price action forming an ending diagonal. Especially considering the amount of the seen decrease it appears that the downfall should shortly end which is why the horizontal level would serve as an indication point from which a recovery could be triggered.
If the price finds support recovery to the upside would be expected potentially all the way up to $109.356 or at least to the $86 area where the significant horizontal support zone was broken. But if the price continues decreasing past the level interaction with the next one would look more likely which would be at around $57.5.
EOS/USD
Last week on Thursday the price of EOS was sitting at $3.31 at its lowest spike from where we’ve seen a 14% recovery until Monday when the price reached $3.78 at its highest. But from Monday we have seen another downtrend developing with the price moving back to the last week’s low vicinity above which it is currently being traded at $3.588.
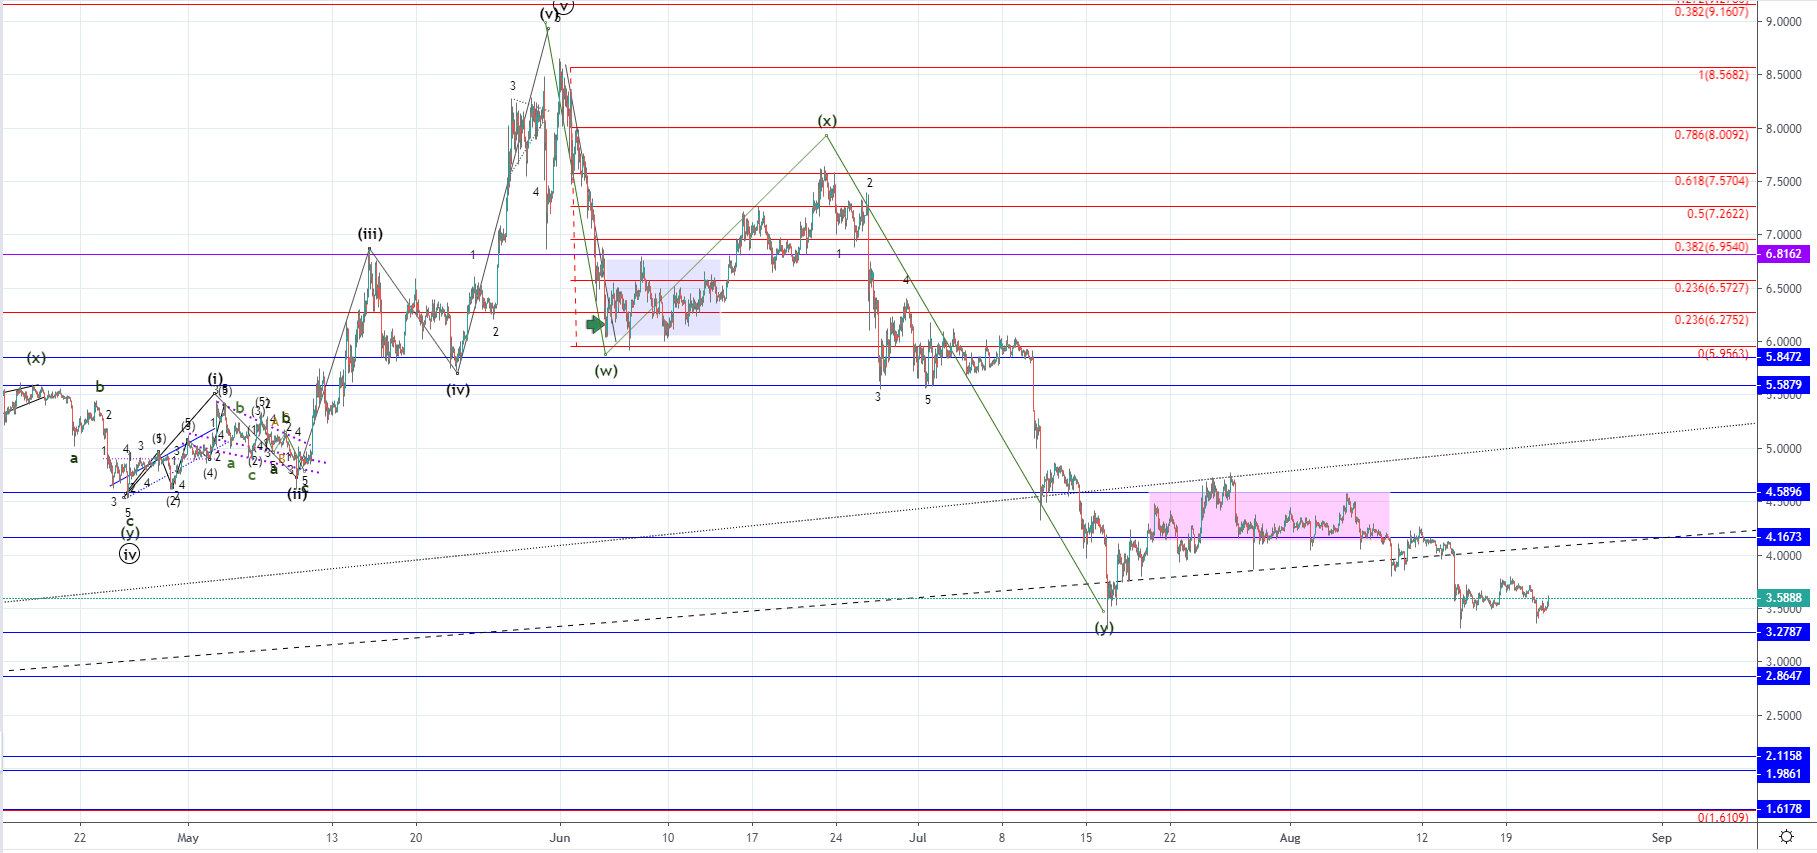 On the hourly chart, you can see that after a breakout from the horizontal range above $4.16 a lower low has been made compared to the ending point of the corrective wave Y which could indicate that the correction got prolonged by two more waves similarly like in the case of Litecoin. The price has gotten close the horizontal level at $3.27 but there hasn’t been an interaction made but that might change soon as the price is retesting the minor horizontal resistance level and it experiencing seller’s pressure.
As we’ve seen a decrease of 10.1% from Monday’s high the recovery might start but the wave structure is implying that in either way another lower low should be expected before the start of a meaningful recovery. If the WXY correction got prolonged by two more waves, the horizontal range would have been the second wave X while the downside move seen after as a breakout is the Z wave. This means that recovery is to soon be expected but there aren’t any signs of a reversal coming soon which is why another low would look more likely. If the price continues moving to the downside the next price target for the ending point of the Z wave could be around $2.86 level, while we could see an even further decline to $2 area.
FXOpen offers the world's most popular cryptocurrency CFDs*, including Bitcoin and Ethereum. Floating spreads, 1:2 leverage — at your service. Open your trading account now or learn more about crypto CFD trading with FXOpen.
*At FXOpen UK and FXOpen AU, Cryptocurrency CFDs are only available for trading by those clients categorised as Professional clients under FCA Rules and Professional clients under ASIC Rules respectively. They are not available for trading by Retail clients.
This article represents the opinion of the Companies operating under the FXOpen brand only. It is not to be construed as an offer, solicitation, or recommendation with respect to products and services provided by the Companies operating under the FXOpen brand, nor is it to be considered financial advice.
Latest articles

Anchored VWAP and How You Can Use It in Forex Trading
In the world of forex trading, understanding the nuanced tools at your disposal can significantly enhance decision-making processes. One such sophisticated tool is the Anchored Volume-Weighted Average Price (Anchored VWAP), which refines the standard VWAP by allowing traders to set

META Share Price Collapses after Publication of Quarterly Report
Just yesterday, META's stock price closed at USD 493.50, up approximately 40% since the start of 2024 and up nearly 300% since the start of 2023.
However, following the release of Meta's quarterly report, its shares plummeted to USD

USD/JPY Analysis: The Rate Exceeds The Level of 155 Yen Per US Dollar
Today, the price of USD/JPY once again renewed its 34-year high, exceeding the level of 155 yen per dollar, which put pressure on the current authorities.
According to Reuters, officials are trying to maintain calm in the market.
"We