


FXOpen
LTC/USD
From Mondays low at $42.76 the price of Litecoin has increased by 13.61% measured to its highest point at $48.58 made yesterday. The price is currently being traded at $47.451 as a minor retracement has occurred of around 2.16%.
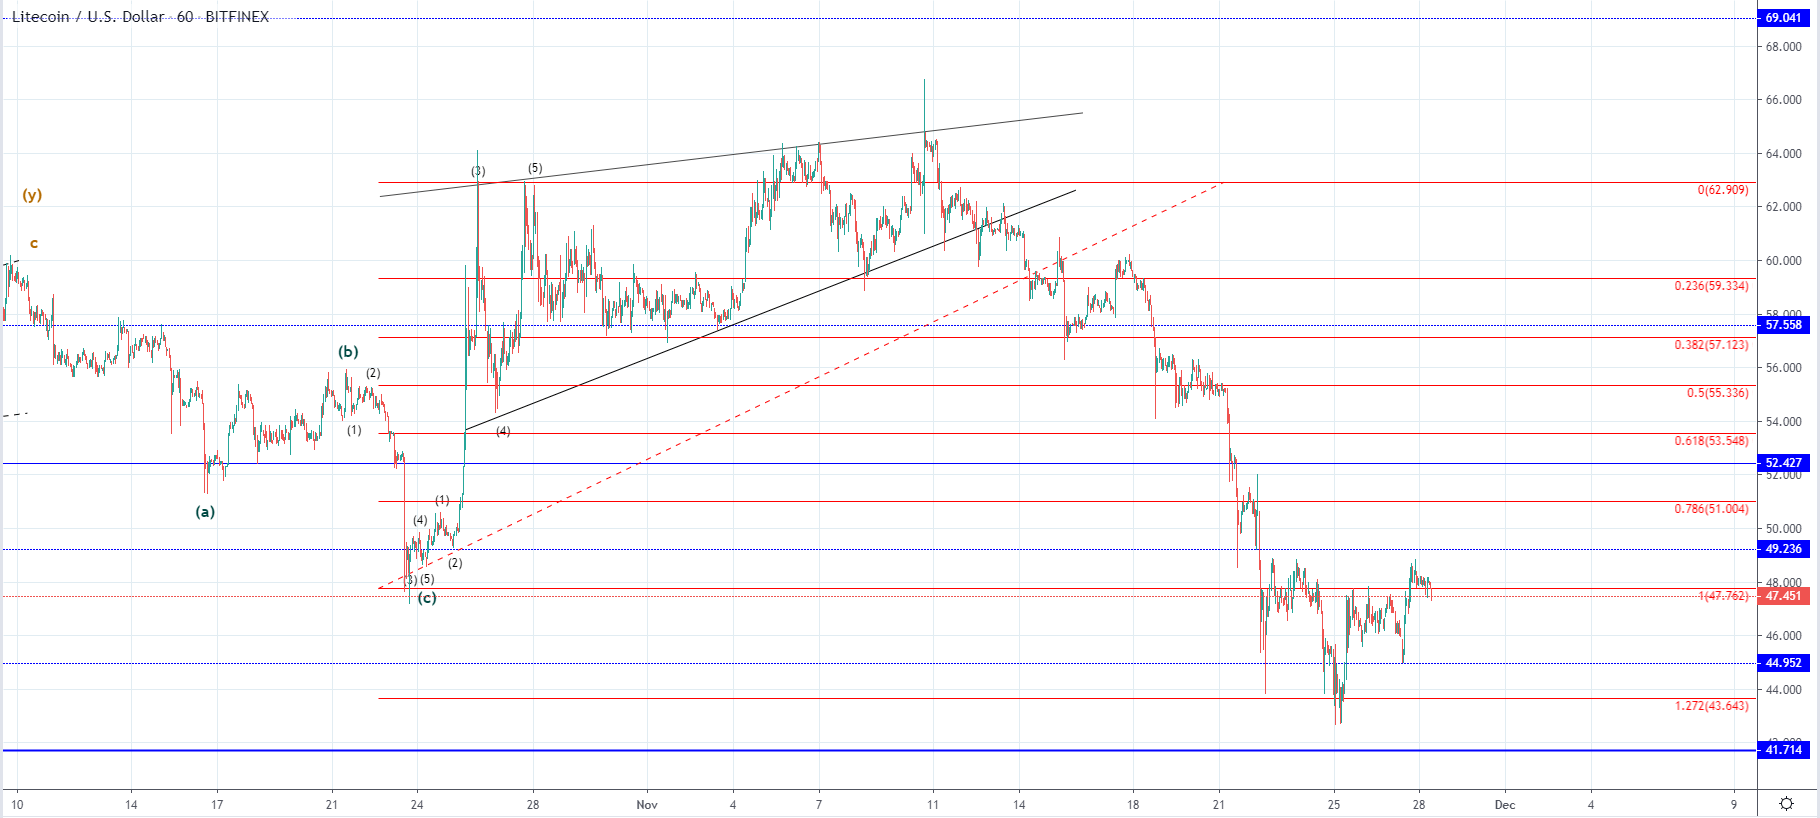
Looking at the hourly chart, we can see that the price of Litecoin found support on the 1.272 Fib level on Monday’s low after a decrease of 33.88% measured from its highest point on the 10. November at $64.66. This has most likely been the end of the decrease after a breakout from the ascending triangle with the price making a lower low.
As a lower low was made compared to the one at $47.8 on the 23rd of October the count in which we have seen the starting impulse wave to the upside was invalidated. This means that the price of Litecoin is undergoing another corrective move which is a three-wave one to the upside. In that case, the new seen increase is its developing 3rd wave after which the price will continue moving to the downside establishing further lows.
This will be evaluated from the expected increase which is to develop in a five-wave manner and likely below the previous high somewhere around the 0.382 Fibonacci level where the significant horizontal support also was.
EOS/USD
The price of EOS was sitting at $2.357 at its lowest point on Monday from where we have seen an increase of 15.76% measured to its highest point yesterday at $2.7288. A minor retracement has occurred with the price currently sitting slightly lower than yesterday but is above the previous minor high retesting its resistance for support.
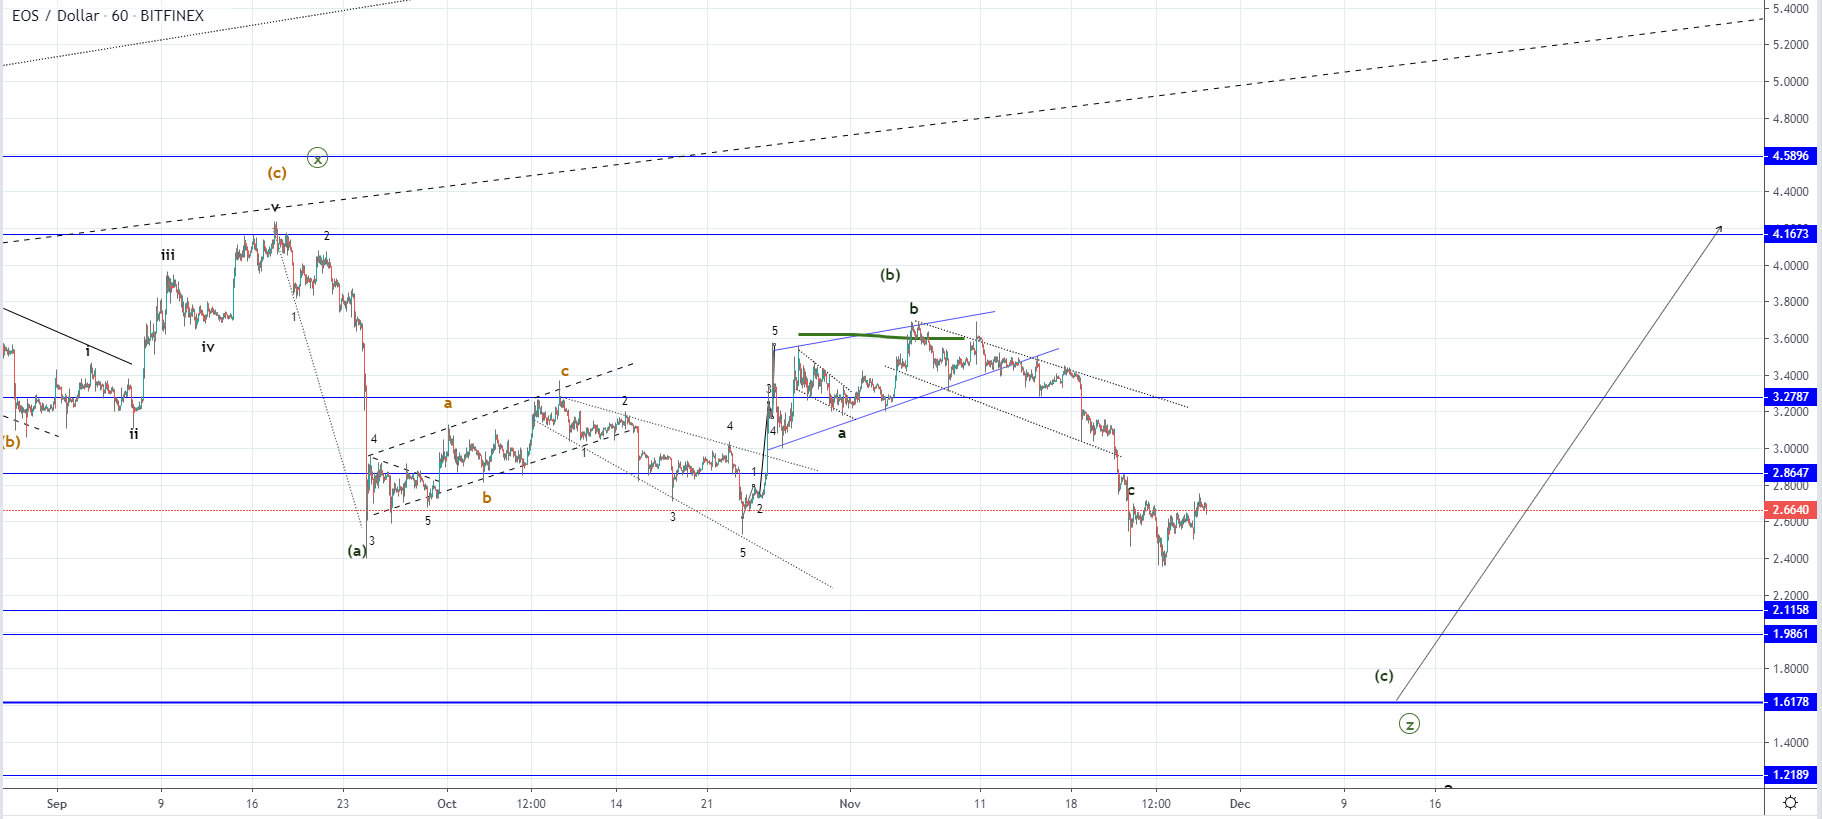
On the hourly chart, we can see that like in the case of Litecoin the price made a lower low compared to the one at $2.66 which is actually currently being tested for resistance. This means that the corrective stage still hasn’t ended and that further lows could be expected before its completion.
The decrease seen after a breakout from the ascending triangle is considered the third wave out of the ABC correction to the downside which is the Z wave of a higher degree. If this is true, then the C wave should develop in a five-wave manner which I don’t believe that it has which is why I would be expecting an interaction with some of the horizontal support levels below. The most significant horizontal level is at $1.617 at it’s December 2018 low but I don’t believe that the price could go there in a straight line.
More likely the decrease would end somewhere in the $2 area as if we project the length of the A wave on to the B wave’s ending point, the target for the C wave ends in that zone.
FXOpen offers the world's most popular cryptocurrency CFDs*, including Bitcoin and Ethereum. Floating spreads, 1:2 leverage — at your service. Open your trading account now or learn more about crypto CFD trading with FXOpen.
*At FXOpen UK and FXOpen AU, Cryptocurrency CFDs are only available for trading by those clients categorised as Professional clients under FCA Rules and Professional clients under ASIC Rules respectively. They are not available for trading by Retail clients.
This article represents the opinion of the Companies operating under the FXOpen brand only. It is not to be construed as an offer, solicitation, or recommendation with respect to products and services provided by the Companies operating under the FXOpen brand, nor is it to be considered financial advice.
Latest articles

Anchored VWAP and How You Can Use It in Forex Trading
In the world of forex trading, understanding the nuanced tools at your disposal can significantly enhance decision-making processes. One such sophisticated tool is the Anchored Volume-Weighted Average Price (Anchored VWAP), which refines the standard VWAP by allowing traders to set

META Share Price Collapses after Publication of Quarterly Report
Just yesterday, META's stock price closed at USD 493.50, up approximately 40% since the start of 2024 and up nearly 300% since the start of 2023.
However, following the release of Meta's quarterly report, its shares plummeted to USD

USD/JPY Analysis: The Rate Exceeds The Level of 155 Yen Per US Dollar
Today, the price of USD/JPY once again renewed its 34-year high, exceeding the level of 155 yen per dollar, which put pressure on the current authorities.
According to Reuters, officials are trying to maintain calm in the market.
"We