


FXOpen

LTC/USD
From last week when the price of Litecoin has been traded at $48.58 we have seen an increase of 29.53% measured to the highest point the price has been on Saturday which was at $62.93. Since then the price has started moving sideways and formed a symmetrical triangle.
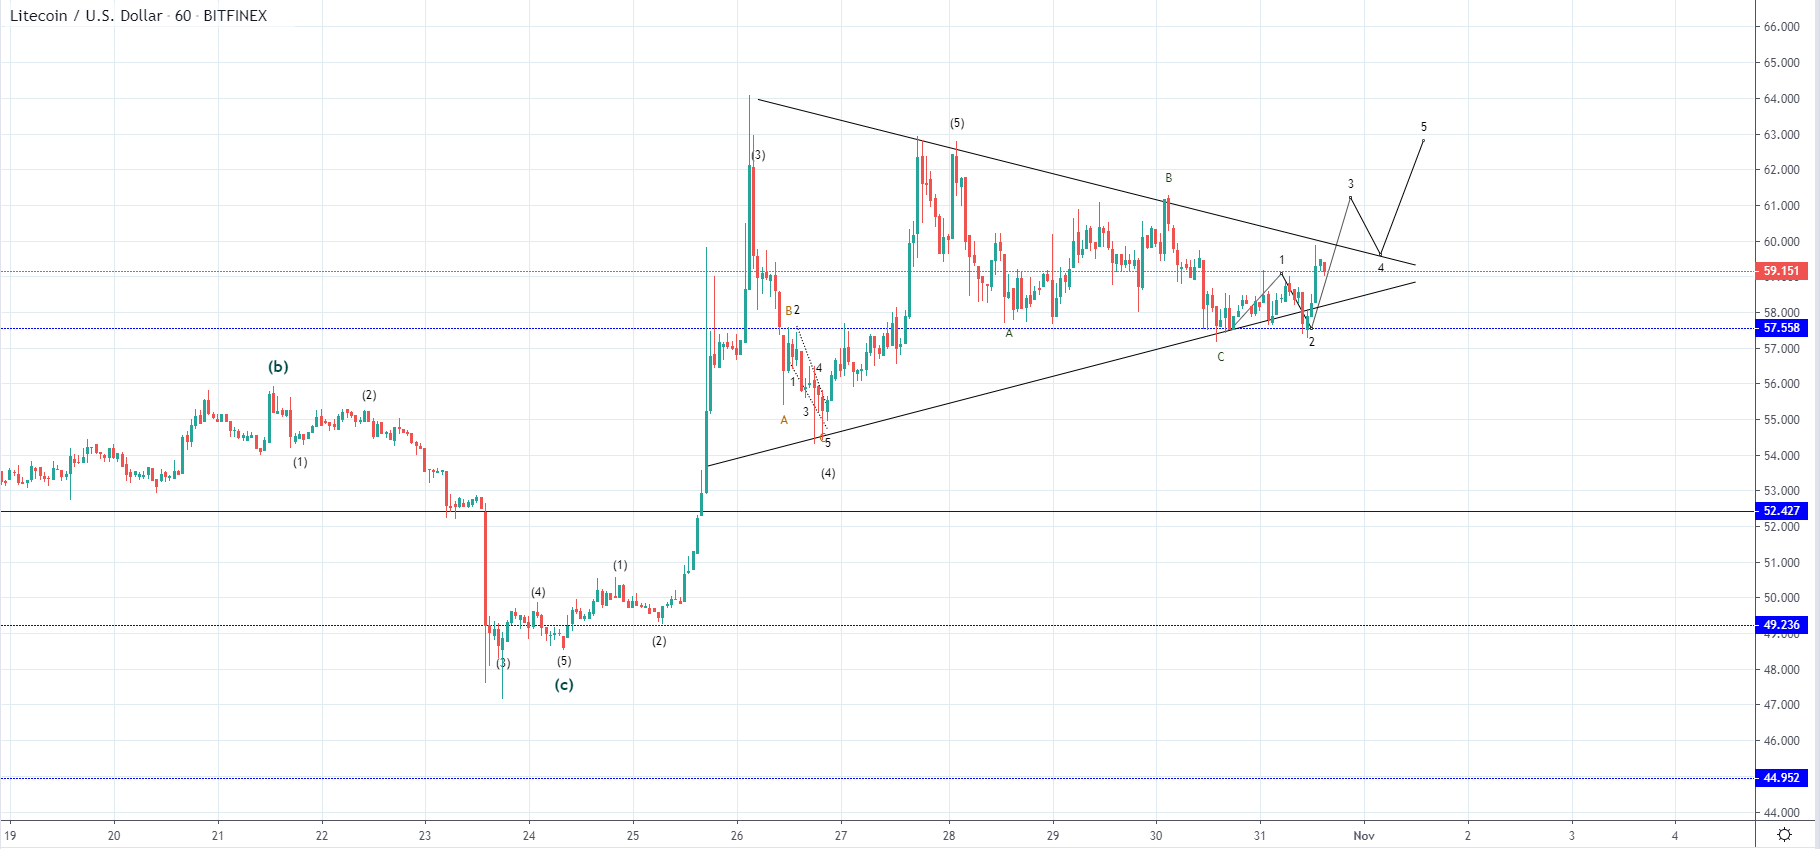 As you can see from the hourly chart as the final ABC to the downside ended we have seen the start of the next impulsive move to the upside. As I’ve counted five-wave the correction which has developed is likely an ABC. The price fell back to retest the $57.558 level and found support there before starting to show signs of bullishness again.
This could be interpreted as the start of the next impulsive move to the upside which would be the first sub-wave of the 3rd wave to the upside. If a breakout from the symmetrical triangle from the upside is made with a retest of its resistance for support and the price finds support there increasing for another wave that would be a clear indication that the possibility of the further price increase will be high in the following days.
It is still unclear whether or not this move will be a 12345 impulse or would be some kind of a corrective move before the price starts continuing its downtrend so the confirmation is still to be made by the anticipated wave structure.
EOS/USD
From last Thursday the price of EOS has increased by 32.51% coming from the $2.663 low to $3.529 high made on Saturday and again retested on Monday. Looking at the hourly chart below you can see that this price movement has been labeled as a five-wave impulse after which the price has been in a minor descending channel.
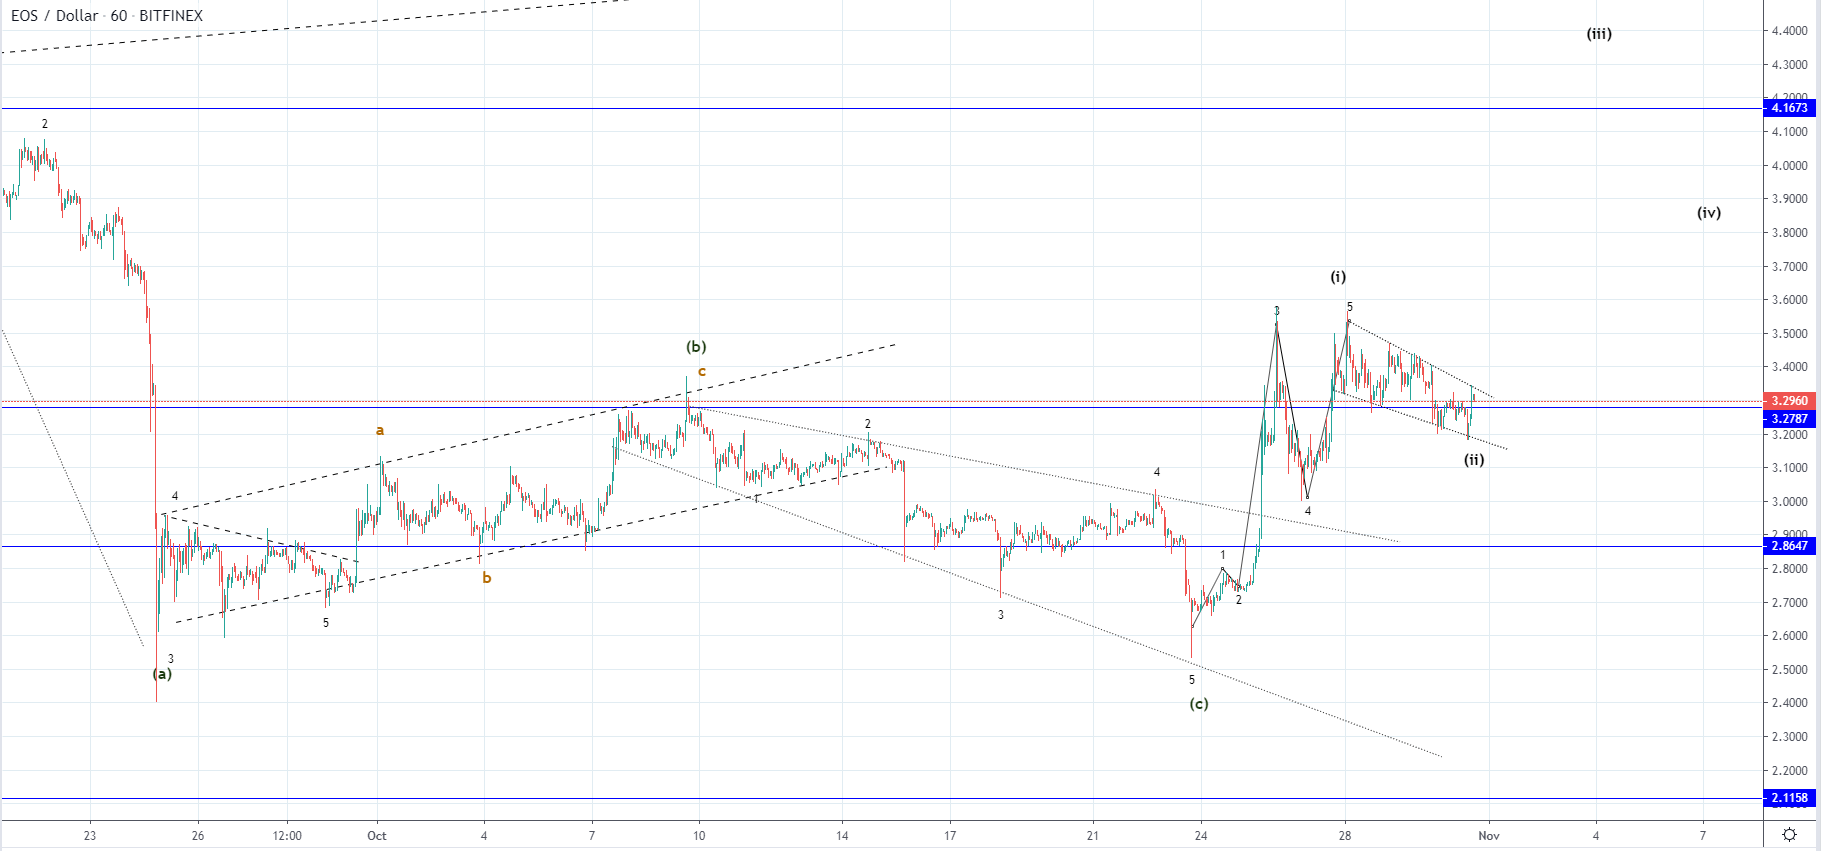
Currently, the price is back above the $3.27 horizontal support level which got broken on the way down but the price started increasing again from yesterday and has reached the resistance point of the descending channel today. As the apex of the channel approaches, we are soon going to see a breakout which by looking at the wave structure looks more likely to the upside.
If the price holds above the $3.27 level now that it managed to put back above and starts breakout out to the upside that would most likely mean that we are seeing the development of the 3rd wave of the higher degree count as the previous correction ended on the 24th of October.
But if the price goes below the currently retested horizontal support further depreciation would look more likely.
FXOpen offers the world's most popular cryptocurrency CFDs*, including Bitcoin and Ethereum. Floating spreads, 1:2 leverage — at your service. Open your trading account now or learn more about crypto CFD trading with FXOpen.
*At FXOpen UK and FXOpen AU, Cryptocurrency CFDs are only available for trading by those clients categorised as Professional clients under FCA Rules and Professional clients under ASIC Rules respectively. They are not available for trading by Retail clients.
This article represents the opinion of the Companies operating under the FXOpen brand only. It is not to be construed as an offer, solicitation, or recommendation with respect to products and services provided by the Companies operating under the FXOpen brand, nor is it to be considered financial advice.
Latest from Cryptocurrencies
Latest articles
What Order Imbalance Is and How To Use It in a Trading Strategy
Understanding the nuances of order imbalances is key for traders looking to navigate the ebb and flow of asset prices. Order imbalances provide a clear window into the supply and demand dynamics at play, offering strategic insights. This article delves

XAU/USD Gold Price Reaches an Important Resistance Zone
The XAU/USD gold chart today indicates that the historical record price of the metal is above USD 2,400 per ounce.
In addition to fears of a new round of inflation due to rising commodity prices, geopolitical tensions are

What Is a Break of Structure and How Can You Trade It?
In the ever-evolving world of Smart Money Concept (SMC) trading, a nuanced understanding of market dynamics is indispensable. This article explores the concept of Break of Structure (BOS), how to identify it, and its implications for trading strategies, setting traders