


FXOpen
LTC/USD
From Mondays open at $63 the price of Litecoin fell by around 10% as it came down to $56.7 the following day. Since then we have seen the formation of the local ascending range but in which the price recovered by 4.21% coming to $59 at its highest point yesterday.
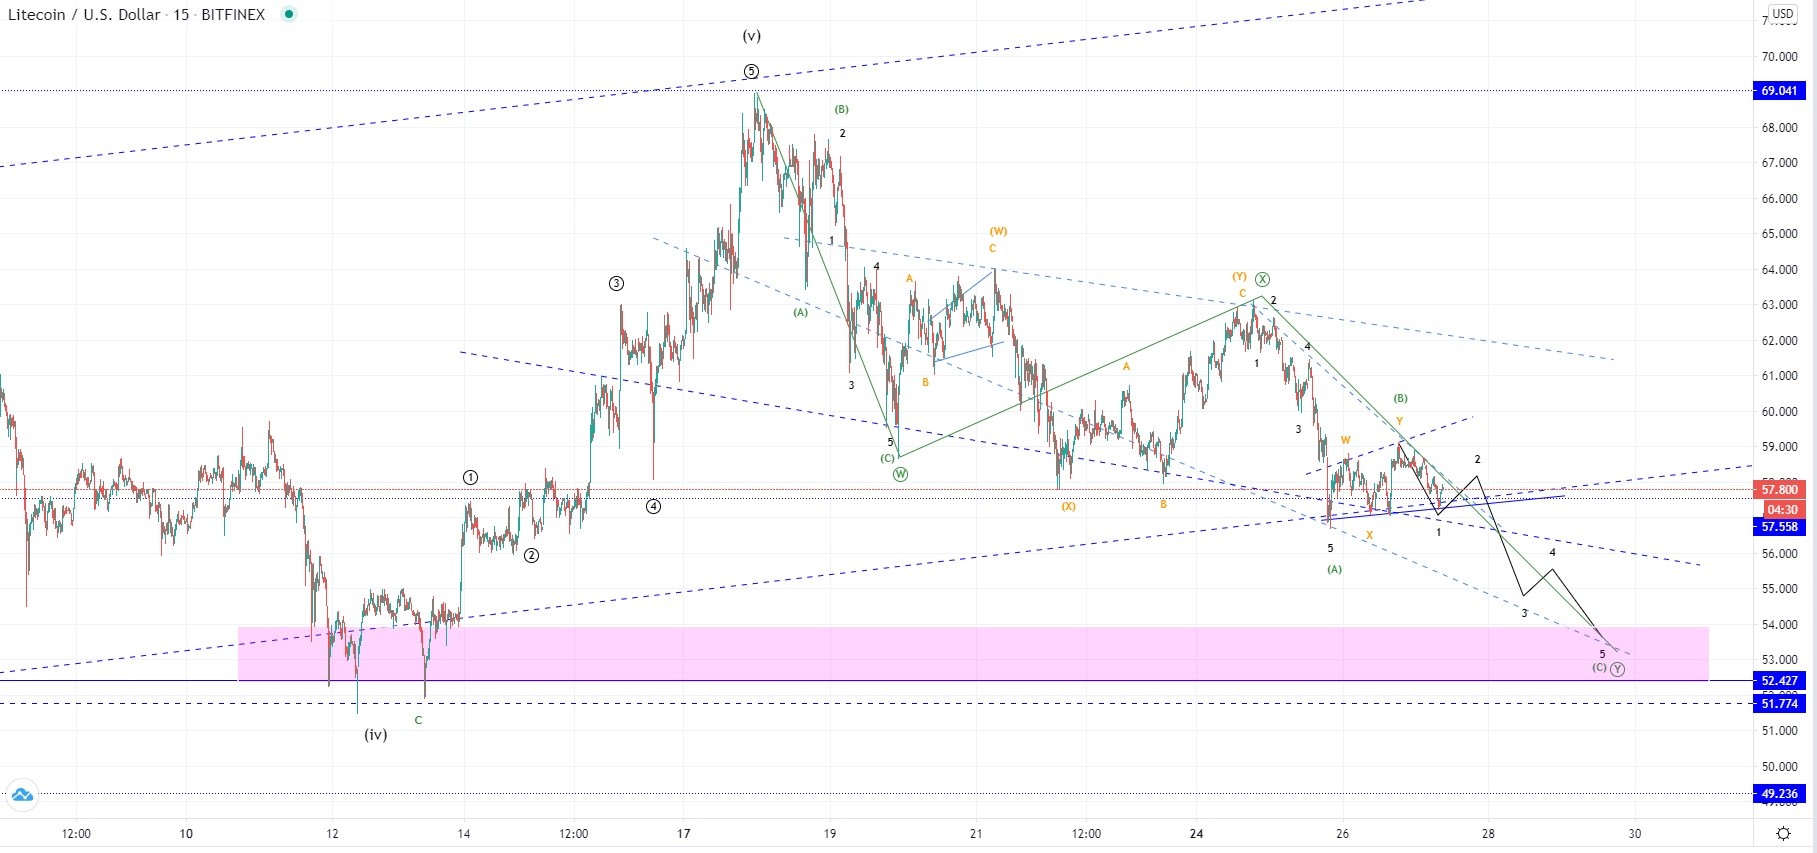
Today on the 15-min chart, we have seen another bounce from the ascending channels support on the slightly higher high. Now the price is again in an upward trajectory and is being traded around $58.
Even though the price found support and is moving the upside again it would be expected that the downward pressure continues shortly as this ascending channel we have seen forming after the Tuesday’s low was most likely corrective in nature.
Another five-wave move to the downside would be the C wave of the higher degree and is the third wave from the WXY count. This corrective count started after the completion of the 5th wave to the upside when the price reached $69 area. It is why we are likely to see further decline below the current ascending support.
If the count is correct then we could expect to see the price of Litecoin going back to revisit the support zone between $52-54 level.
An alternative possibility would be that from here the price continues moving to the upside and comes to retest the still unconfirmed descending channel of a higher degree resistance level where the X wave got validated. But as the correction from the 18th of August looks underdeveloped further downside would still be expected after.
EOS/USD
The price of EOS made a decrease of over 13% from Monday’s high at $3.427 as it dipped below $3 but snapped back above it before the 15-min candle closed. Currently, we have seen a recovery taking place but the momentum behind the upward move losing power.
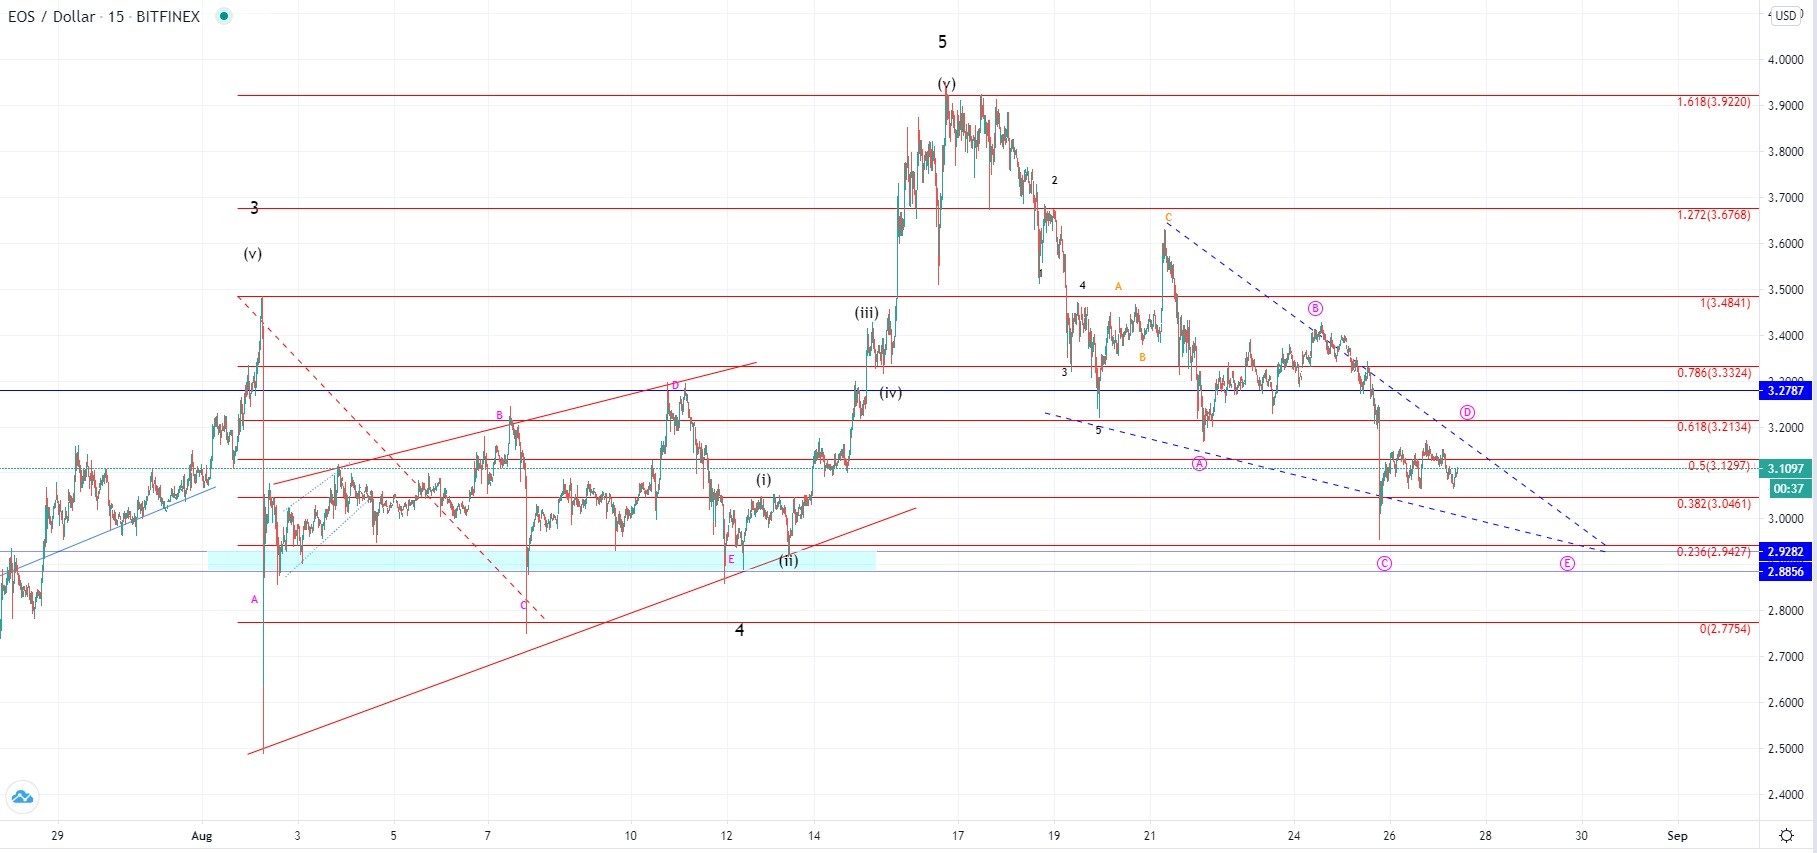
On the 15-min chart, we can see that similarly like in the case of Litecoin the price of EOS made a sharp decline from Monday and made a local ascending range. This could be the 4th wave out of the ABCDE count or some other corrective move but further downside for another lower low would be expected as well.
Resistance was found around the 0.5 Fibonacci level which was tested on today’s recovery and the price is now showing signs of struggle, looking like it may reverse its trajectory. We could see another minor increase would go to retest the still unconfirmed descending triangle but would, in that case, validate the level.
The price of EOS is likely to revisit its horizontal support zone from the previous corrective move made on the 2nd of August till the 7th and was then again tested on the 11th when the price dipped below the 0.236 Fib level.
But after the correction ends there is a possibility that we are going to see the price of EOS continuing its higher degree move to the upside and makes new higher highs above $4 mark.
FXOpen offers the world's most popular cryptocurrency CFDs*, including Bitcoin and Ethereum. Floating spreads, 1:2 leverage — at your service. Open your trading account now or learn more about crypto CFD trading with FXOpen.
*At FXOpen UK and FXOpen AU, Cryptocurrency CFDs are only available for trading by those clients categorised as Professional clients under FCA Rules and Professional clients under ASIC Rules respectively. They are not available for trading by Retail clients.
This article represents the opinion of the Companies operating under the FXOpen brand only. It is not to be construed as an offer, solicitation, or recommendation with respect to products and services provided by the Companies operating under the FXOpen brand, nor is it to be considered financial advice.
Latest articles

Anchored VWAP and How You Can Use It in Forex Trading
In the world of forex trading, understanding the nuanced tools at your disposal can significantly enhance decision-making processes. One such sophisticated tool is the Anchored Volume-Weighted Average Price (Anchored VWAP), which refines the standard VWAP by allowing traders to set

META Share Price Collapses after Publication of Quarterly Report
Just yesterday, META's stock price closed at USD 493.50, up approximately 40% since the start of 2024 and up nearly 300% since the start of 2023.
However, following the release of Meta's quarterly report, its shares plummeted to USD

USD/JPY Analysis: The Rate Exceeds The Level of 155 Yen Per US Dollar
Today, the price of USD/JPY once again renewed its 34-year high, exceeding the level of 155 yen per dollar, which put pressure on the current authorities.
According to Reuters, officials are trying to maintain calm in the market.
"We