


FXOpen

LTC/USD
From yesterday’s high at $60.28 the price of Litecoin has decreased by 9.14% as it came down to the $54.8 level at its lowest point today. The price is currently being traded around $55.84 but is in a downward trajectory overall.
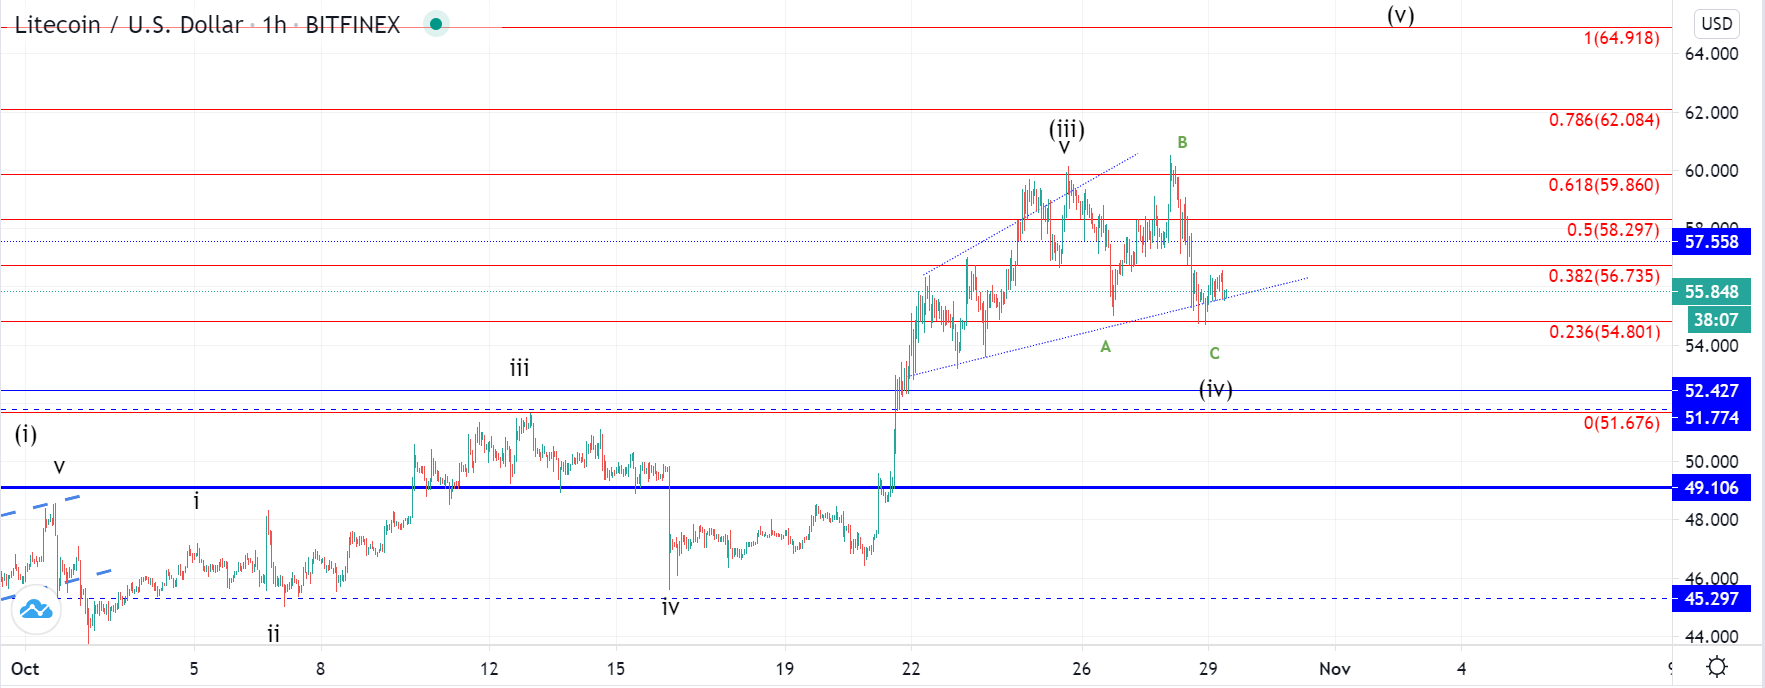
Looking at the hourly chart, we can see that the price came down today to 0.236 Fibonacci level and was supported there. Since this bounce, the price came back to the upper Fib level at 0.382 and has now started testing the ascending trendline from the corrective range for support.
This ascending range is most likely the corrective 4th wave out of the higher degree impulse wave as the 3rd one ended as an interaction with the 0.618 Fibonacci level at $59.86. If this is true we have seen the development of an ABC running flat correction with its B wave coming to retest the high and after finding resistance once again another impulsive move which was the C wave developed today.
As the price has been impulsively increasing since the 21st of October this upside move is expected to continue for another higher high which would be the 5th wave from the Minuette count but it is still unclear whether or not the 4th wave ended today’s downfall.
This is why we are shortly going to receive validation by looking at the price behavior on the current support level as if the price finds support here and continues increasing that would most likely mean that the 4th wave has been completed.
EOS/USD
The price of EOS has been moving sideways in these last couple of days after it decreased from $2.742 to $2.6 level on Monday which was a downfall of 5.1%. But since then it made a recovery, spiking up to the level from which the downfall was made and again fell back slightly above Monday’s low.
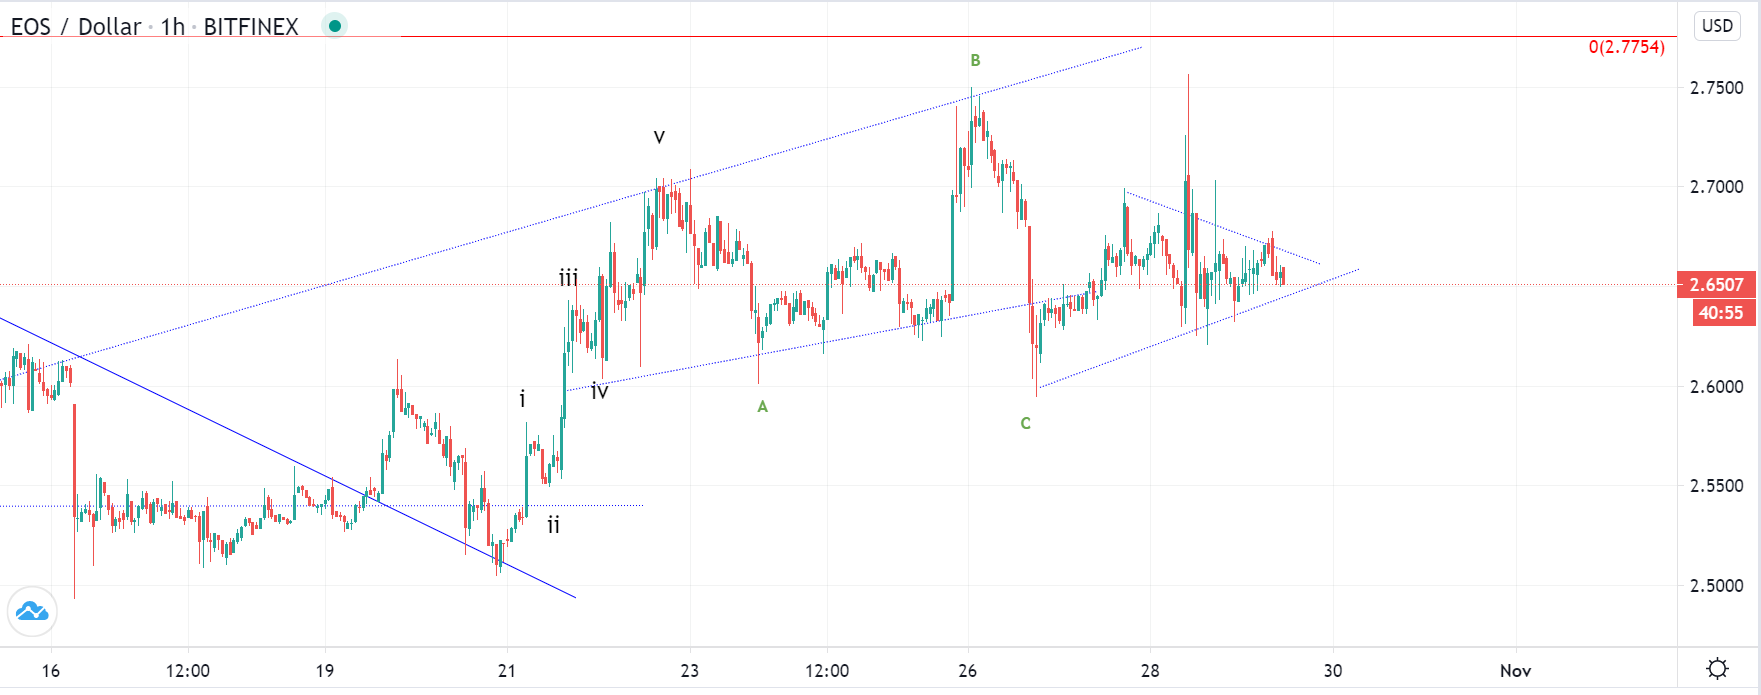
This sideways action has started developing after an impulsive decline which could have been the completion of the corrective C wave of the ABC count from the 22nd of October when the price ended its lower degree five-wave move. If this is true then this could be a consolidation count and especially so as it started forming a symmetrical triangle.
With its support level being slightly steeper the breakout to the upside looks more probable but there is still a possibility that the corrective count would get extended with further decline ahead. This is why we are going to get a validation from the breakout direction shortly from whose direction we are going to evaluate these possibilities.
FXOpen offers the world's most popular cryptocurrency CFDs*, including Bitcoin and Ethereum. Floating spreads, 1:2 leverage — at your service. Open your trading account now or learn more about crypto CFD trading with FXOpen.
*At FXOpen UK and FXOpen AU, Cryptocurrency CFDs are only available for trading by those clients categorised as Professional clients under FCA Rules and Professional clients under ASIC Rules respectively. They are not available for trading by Retail clients.
This article represents the opinion of the Companies operating under the FXOpen brand only. It is not to be construed as an offer, solicitation, or recommendation with respect to products and services provided by the Companies operating under the FXOpen brand, nor is it to be considered financial advice.
Latest articles

Anchored VWAP and How You Can Use It in Forex Trading
In the world of forex trading, understanding the nuanced tools at your disposal can significantly enhance decision-making processes. One such sophisticated tool is the Anchored Volume-Weighted Average Price (Anchored VWAP), which refines the standard VWAP by allowing traders to set

META Share Price Collapses after Publication of Quarterly Report
Just yesterday, META's stock price closed at USD 493.50, up approximately 40% since the start of 2024 and up nearly 300% since the start of 2023.
However, following the release of Meta's quarterly report, its shares plummeted to USD

USD/JPY Analysis: The Rate Exceeds The Level of 155 Yen Per US Dollar
Today, the price of USD/JPY once again renewed its 34-year high, exceeding the level of 155 yen per dollar, which put pressure on the current authorities.
According to Reuters, officials are trying to maintain calm in the market.
"We