


FXOpen

The Momentum indicator is one of the most exciting oscillators available to technical analyze financial markets. Like any oscillator, it appears at the bottom of a chart.
Many traders consider it as a benchmark for volatility too. If that’s the case or not, we’ll let you decide after reading this article.
Like the name suggests, and as it is the case with almost all oscillators, traders use the Momentum to spot divergences with the price. A bullish divergence calls for a long trade, and a bearish divergence for a short trade.
How to Use the Momentum Indicator
Like the name suggests, the Momentum indicator shows just like that: the price momentum. If you want, it is the closest technical indicator that comes to reading price action.
The MetaTrader4, the most popular trading platform, uses the 14 periods as the default setting with the Momentum indicator. It means that the oscillator considers fourteen candles before plotting a value.
Because indicators use past prices to plot current projections, traders focus most on what the indicator shows, rather than what the price tells. For this reason, divergences work well with oscillators, especially with one like the Momentum indicator.
On the MT4 platform, the Momentum indicator travels only in positive territory. More precisely, it travels around the 100 level, even though the level is not marked on the indicator’s window.
However, this is, if you want, the equilibrium level, and one of the ways to use the Momentum indicator a volatility indicator. Here’s the recent EURUSD price action on the 4h chart, having the Momentum (14) applied at the bottom of it:
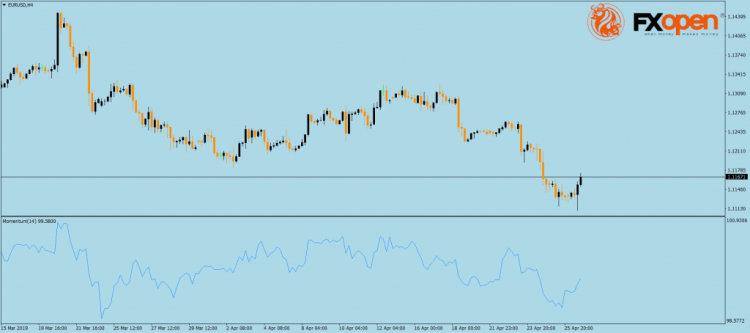
As you can see, the 100 level isn’t there. However, if we add it by using the indicator’s edit function, we have a brand-new vision of what the Momentum indicator tells us:
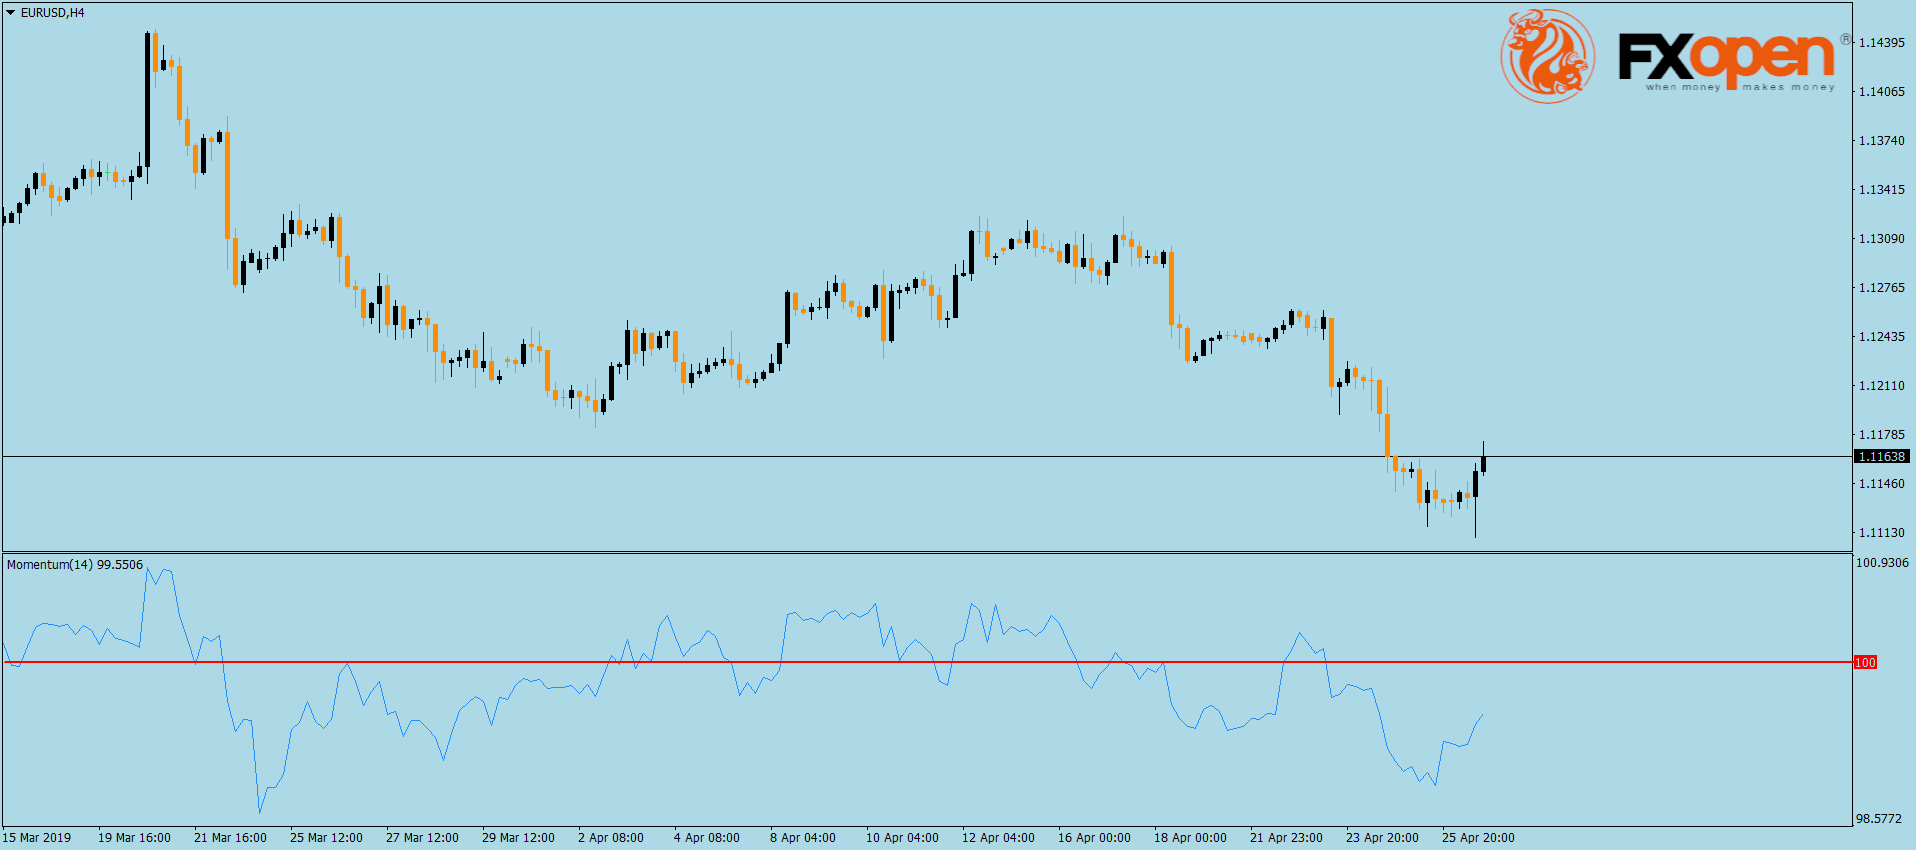
The red line marks the 100 level, but it also fulfills another important role: it divides the price action into bullish and bearish. In other words, when the Momentum indicator moves below the red line, the market is bearish. Above it, is bullish. Here are some examples:
Divergences with Momentum
But that is not the only way to use the Momentum indicator. In fact, by adding the 100 level, traders merely have an idea about how volatile a market really is.
The more the Momentum sits around the 100 level, the lower the volatility is. The further it goes from the 100 level, the higher the volatility and most likely the market is trending.
By dividing the Momentum into values above and below the 100 level, we can look for divergences with the price. Remember that traders rely on the oscillator more than they do on the price, due to the bigger period interpreted by the oscillator.
The 100 level helps when trading divergences too. While above the 100 level, the possibility of a bearish divergence exists. Below, and traders look for bullish ones.
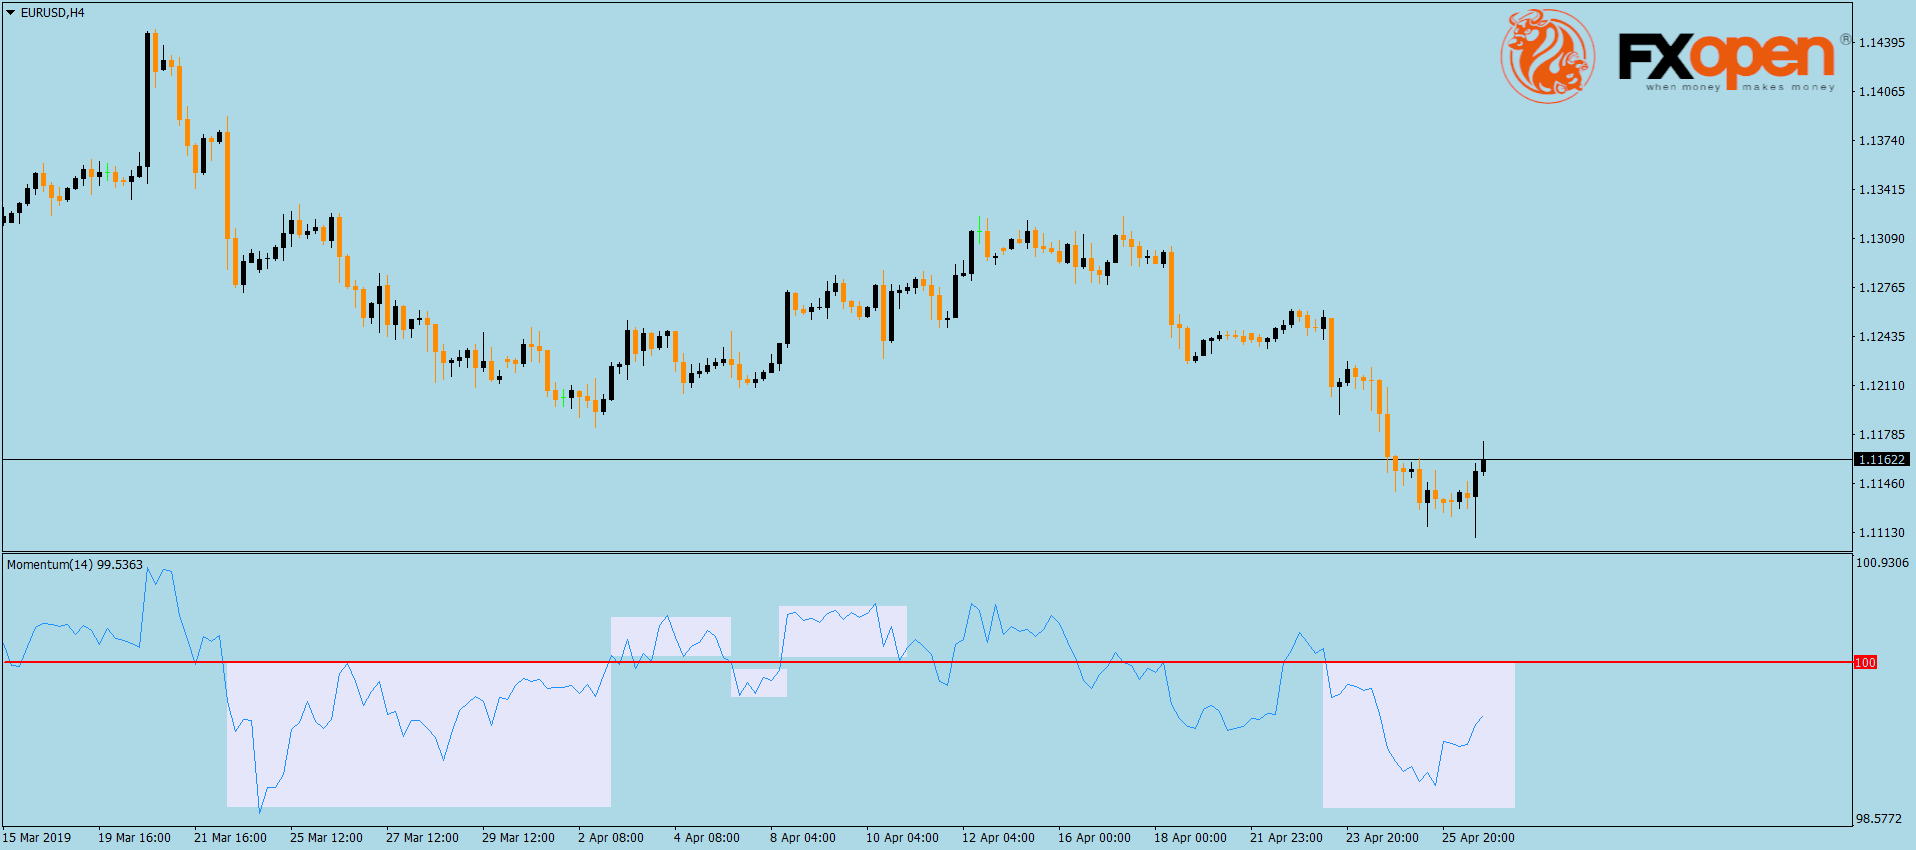
The same EURUSD chart gives two beautiful examples. From left to right, the price kept falling, but the Momentum failed to make a new low. That’s a bullish divergence, and it proved to be accurate.
Moving forward, the price made two higher highs towards the end of its bullish movement, but the Momentum started to decline, heading towards its equilibrium level. In other words, no follow-through whatsoever, and the price dropped in consequence.
Conclusion
Technical analysis is full of all kinds of indicators. Either trend indicators or oscillators, they help traders making an educated decision when buying or selling a financial asset.
However, some indicators work better than others. And, when using imagination in setting them up, traders end up having an edge and increasing their chances to profit from market moves.
This article represents the opinion of the Companies operating under the FXOpen brand only. It is not to be construed as an offer, solicitation, or recommendation with respect to products and services provided by the Companies operating under the FXOpen brand, nor is it to be considered financial advice.
Latest articles

What Is a Break of Structure and How Can You Trade It?
In the ever-evolving world of Smart Money Concept (SMC) trading, a nuanced understanding of market dynamics is indispensable. This article explores the concept of Break of Structure (BOS), how to identify it, and its implications for trading strategies, setting traders
Hong Kong Stocks Become Top Risers After Wild Ride Subsides
Hong Kong enjoyed a sterling reputation for an entire century as a highly polished, utterly stable mantlepiece upon which global corporations could comfortably sit and where an international talent base could reside in fabulous surroundings and approach European, American, African

Brent Oil Price Did Not Rise Despite Iran's Attack on Israel
As you know, Iran launched a missile attack on Israel over the weekend. This could greatly increase the price of Brent oil, given that Iran is one of the top 10 oil producing countries, and the fact of the strike