


FXOpen

Contracting triangles are the favorite way of markets to consolidate. For this reason, whenever it is likely that the market consolidates (e.g., a few days ahead of the NFP – Non-Farm Payrolls report), the chances favor a contracting triangle to form.
Various types of contracting triangles exist. From symmetrical to irregular, from running to non-limiting, from ascending to descending – they show the market consolidation until a breakout comes.
The key to trading a contracting triangle is to label it correctly. Only by interpreting all its elements, traders make the most of such patterns.
What is the Apex of a Triangle?
All contracting triangles have an apex. As the name suggests, the two trendlines that define the triangle (a-c and b-d according to the Elliott Wave Theory contract.
It means that they will meet somewhere on the right side of the chart. The meeting point is closer or further from the actual triangle, depending on how much the triangle contracts.
The apex is the meeting point. For using it when trading, it must be closer to the triangle.
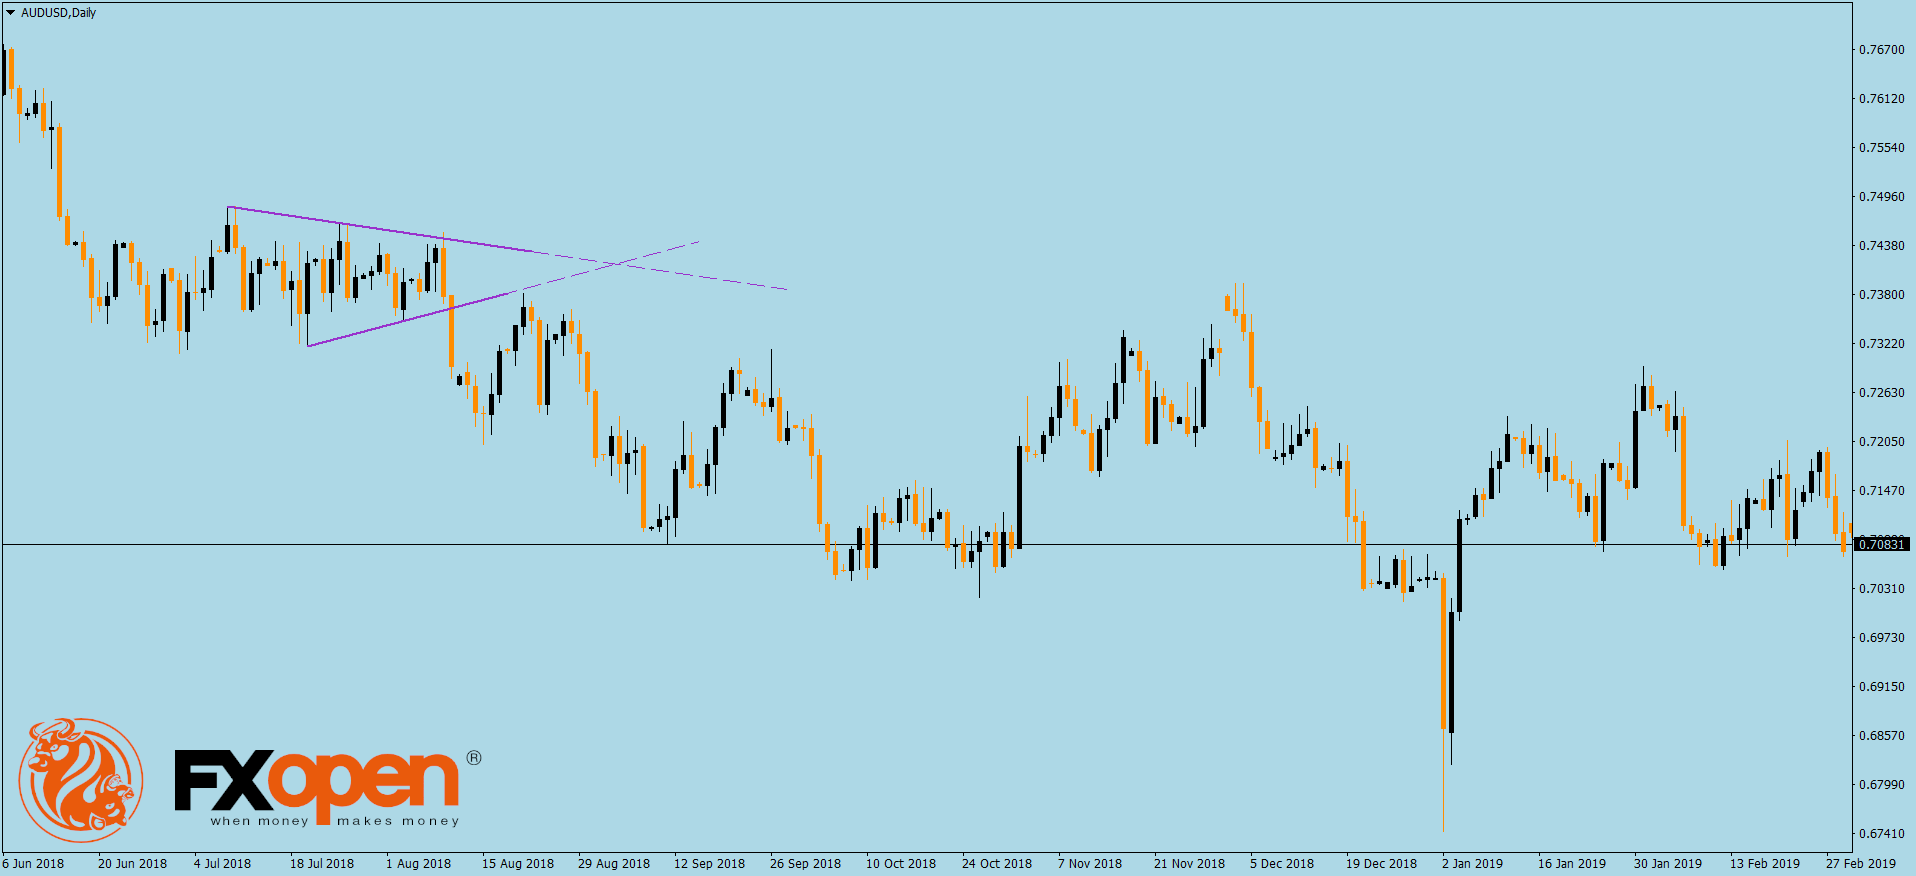
Have a look at the AUDUSD daily chart above. It shows the pair forming a symmetrical contracting triangle before breaking lower.
In other words, the price consolidated for quite some time. In doing that, it formed a series of lower highs and higher lows.
By connecting them, the resulting trendlines give the nature of the triangle. They contract towards a common point, named the apex of a contracting triangle.
How to Use the Apex When Trading Contracting Triangles
Contracting triangles have a measured move. In the case of a symmetrical triangle, the measured move is given by the length of the longest wave.
Elliott Waves Theory uses letters to label corrective waves. For triangles, it uses a-b-c-d-e, just like in the chart below.
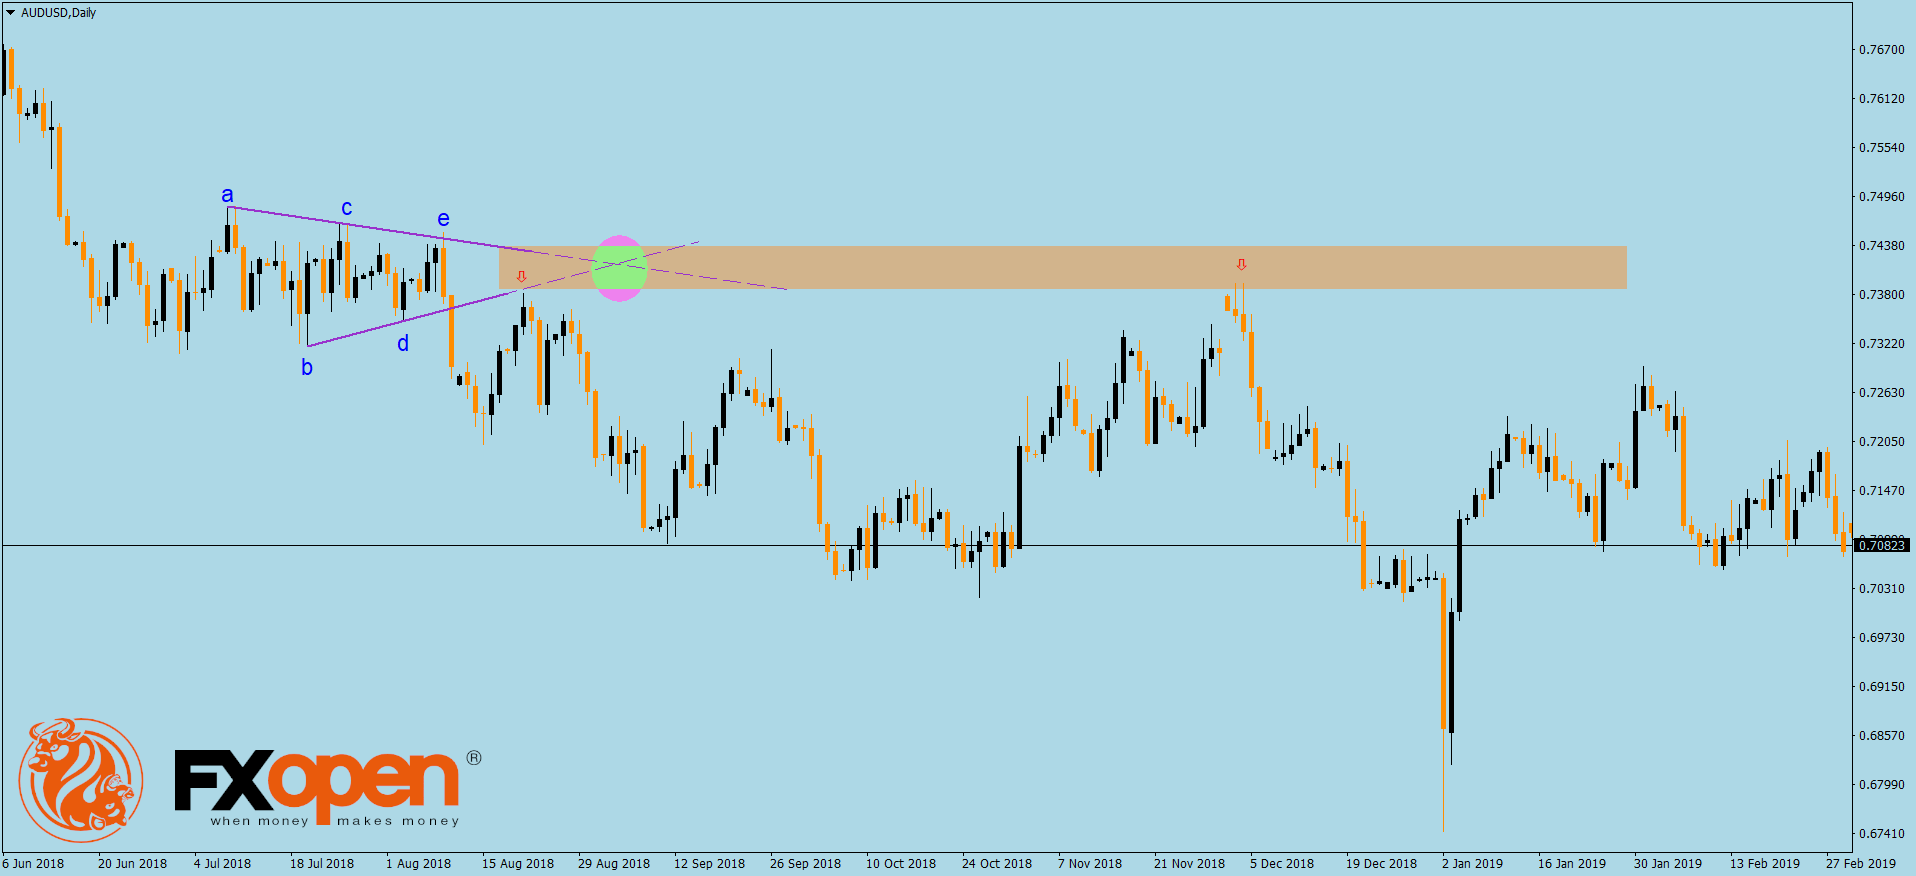
The two trendlines, the a-c, and b-d contract until they meet. That’s the apex, and its role extends further in time, after the triangle breaks.
A typical interpretation of a contracting triangle is to enter on the b-d trendline’s retest. And, to target the measured move, while having a stop-loss order at the end of the e-wave.
That’s what most traders familiar with triangles do. However, the role of a triangle doesn’t end here.
The apex acts as a massive support or resistance level. Because this is the currency market, the apex is not just a fix level. Instead, it is an area, given the significant volatility characteristic to this market.
If the triangle breaks lower, the apex acts as future resistance. If it breaks higher, it’ll serve as future support.
Moreover, the bigger the timeframe, the stronger the support or resistance level becomes. Therefore, a triangle on the monthly timeframe has an apex that gives support and resistance levels challenging to break than a triangle on the hourly chart.
As it is with support and resistance levels, they are poised to be broken. The more the price can reach the apex, the bigger the chances are that the level will eventually give way.
For this reason, savvy traders use only the first test of the apex as support or resistance. Starting with the second retest, if the market doesn’t make a new high or low, it means it’ll blast through the apex.
Conclusion
The apex of a contracting triangle is a powerful technical analysis concept. It is especially important in the case of non-limiting triangles.
In such triangles, the apex considers not only the price (the horizontal support or resistance), but also the time (the point in time where the two trendlines converge).
The one trading theory that uses the concept of the apex of a contracting triangle is the Elliott Waves Theory. Not surprisingly, triangles are one of the most detailed patterns described by Elliott. For this reason, understanding the apex needs a clear understanding of how the Elliott Theory works.
This article represents the opinion of the Companies operating under the FXOpen brand only. It is not to be construed as an offer, solicitation, or recommendation with respect to products and services provided by the Companies operating under the FXOpen brand, nor is it to be considered financial advice.
Latest articles

The Price of Gold XAU/USD Shows Strongest Fall in Almost 2 Years
On Monday, the price of gold fell from USD 2,386 to USD 2,333 per ounce — this is the strongest drop in one day in almost 2 years, according to Bloomberg. On Tuesday morning in the Asian session, the

Hong Kong-listed Chinese Insurer Goes on Rally as Western Giants Retract
The Asia Pacific region has once again become an area of great interest to investors and traders as some remarkable patterns of volatility have begun to make their presence felt.
This morning, a few examples of Hong Kong-listed Chinese companies

Bitcoin Price Bullish after Halving-2024
On April 19, 2024, a halving occurred in the Bitcoin network, resulting in the reward for the mined block amounting to 3.125 BTC.
Historically, after the halving (which is associated with a reduction in supply), the price of Bitcoin