


FXOpen
Gold price declined heavily recently below the $1,295 and $1,280 levels. Crude oil price is facing a strong resistance near the $64.70 level and it may continue to trade in a range for some time.
Important Takeaways for Gold and Oil
- Gold price started a major decline below the $1,295 support area against the US Dollar.
- There are two bearish trend lines formed with resistance near $1,275 and $1,279 on the hourly chart of gold.
- Crude oil price recently tested a bullish trend line with support at $63.80 on the hourly chart.
- XTI/USD failed on many occasions near the $64.70 resistance area, which is a strong hurdle for more upsides.
Gold Price Technical Analysis
Gold price started a significant decline from well above the $1,310 level against the US Dollar. The price broke the $1,300 and $1,295 support levels to move into a bearish zone.
There was a steady drop and bears manage to push the price below the $1,285 level and 50 hourly simple moving average. The price even broke the $1,280 level recently and formed a low near $1,271 on FXOpen.
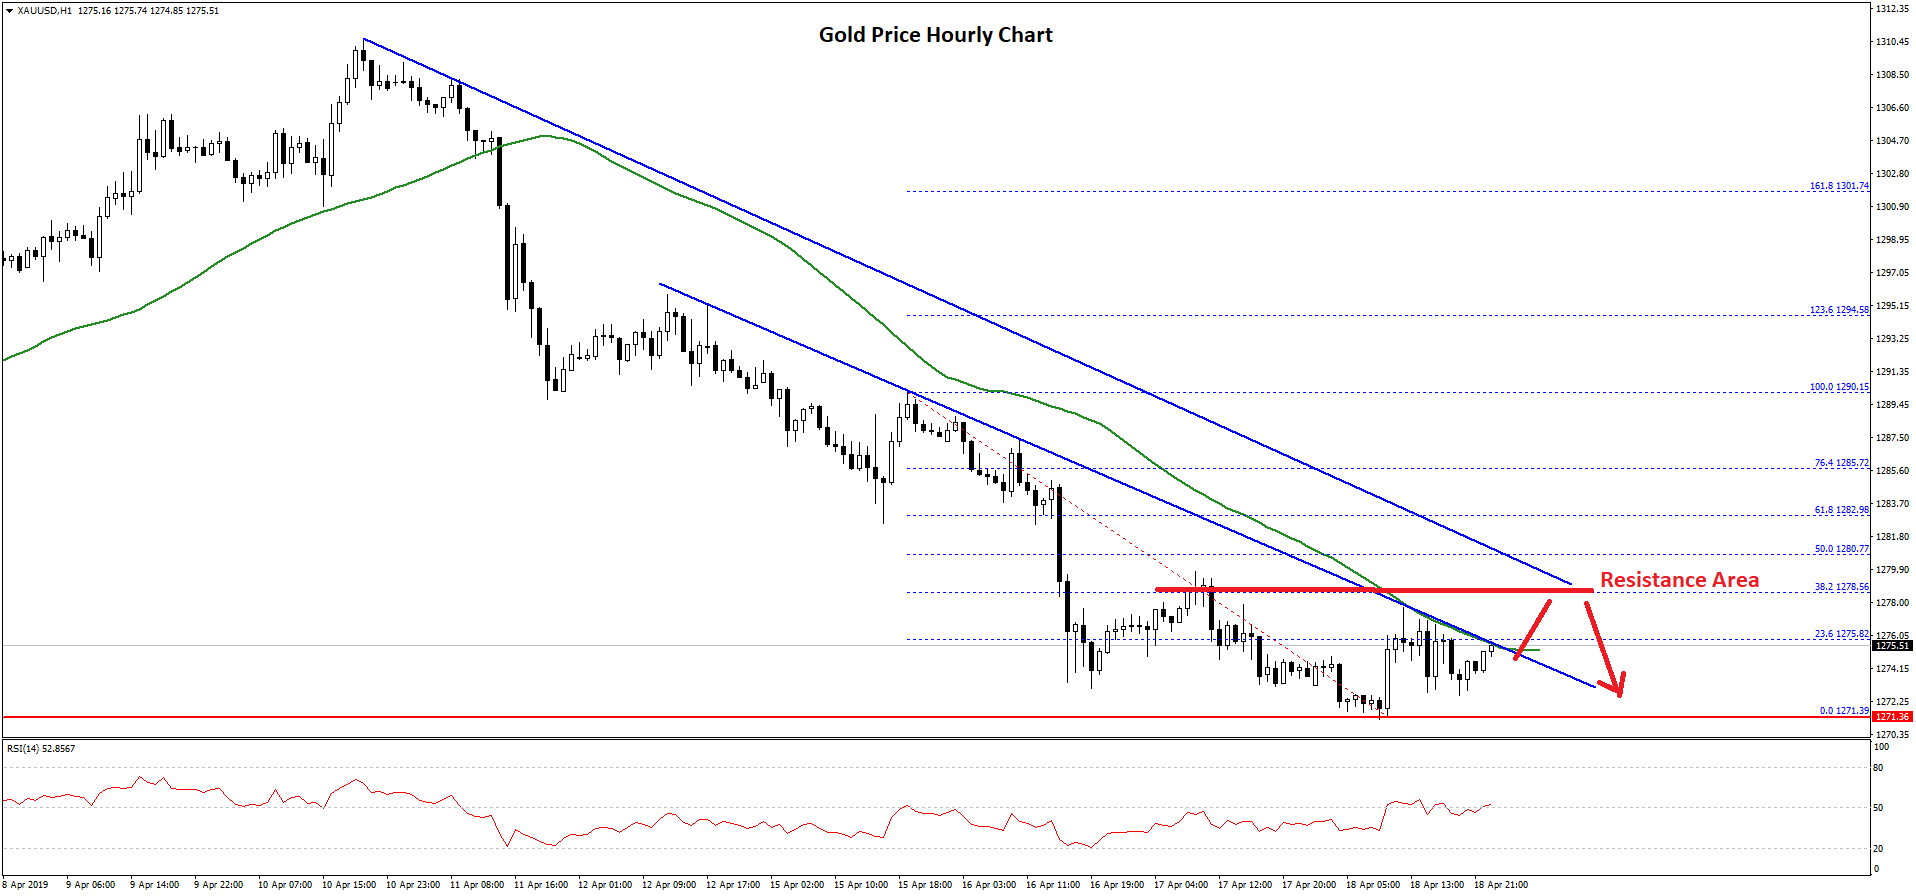
It is currently consolidating gains and recently tested the 23.6% Fib retracement level of the latest decline from the $1,290 high to $1,271 low. However, there are many hurdles on the upside near the $1,275 and $1,278 levels.
There are also two bearish trend lines formed with resistance near $1,275 and $1,279 on the hourly chart of gold. The first trend line near $1,275 also coincides with the 50 hourly simple moving average.
The second trend line is close to the 38.2% Fib retracement level of the latest decline from the $1,290 high to $1,271 low. Having said that, a close above the $1,280 resistance is needed for buyers to gain bullish momentum in the near term.
If there is no break above $1,278 and $1,280, the price could decline further. An initial support is near the $1,270-1,271 area, below which gold price could accelerate towards the $1,265 level.
Oil Price Technical Analysis
Crude oil price remained in a bullish zone above the $62.00 support area against the US Dollar. The price even broke the $63.00 and $64.20 resistance levels, but it struggled to clear the $64.70 level.
The hourly chart suggests that the price failed on multiple occasions near the $64.70 and $64.75 levels. Recently, there was a downside correction below the $64.00 level and the 50 hourly simple moving average.
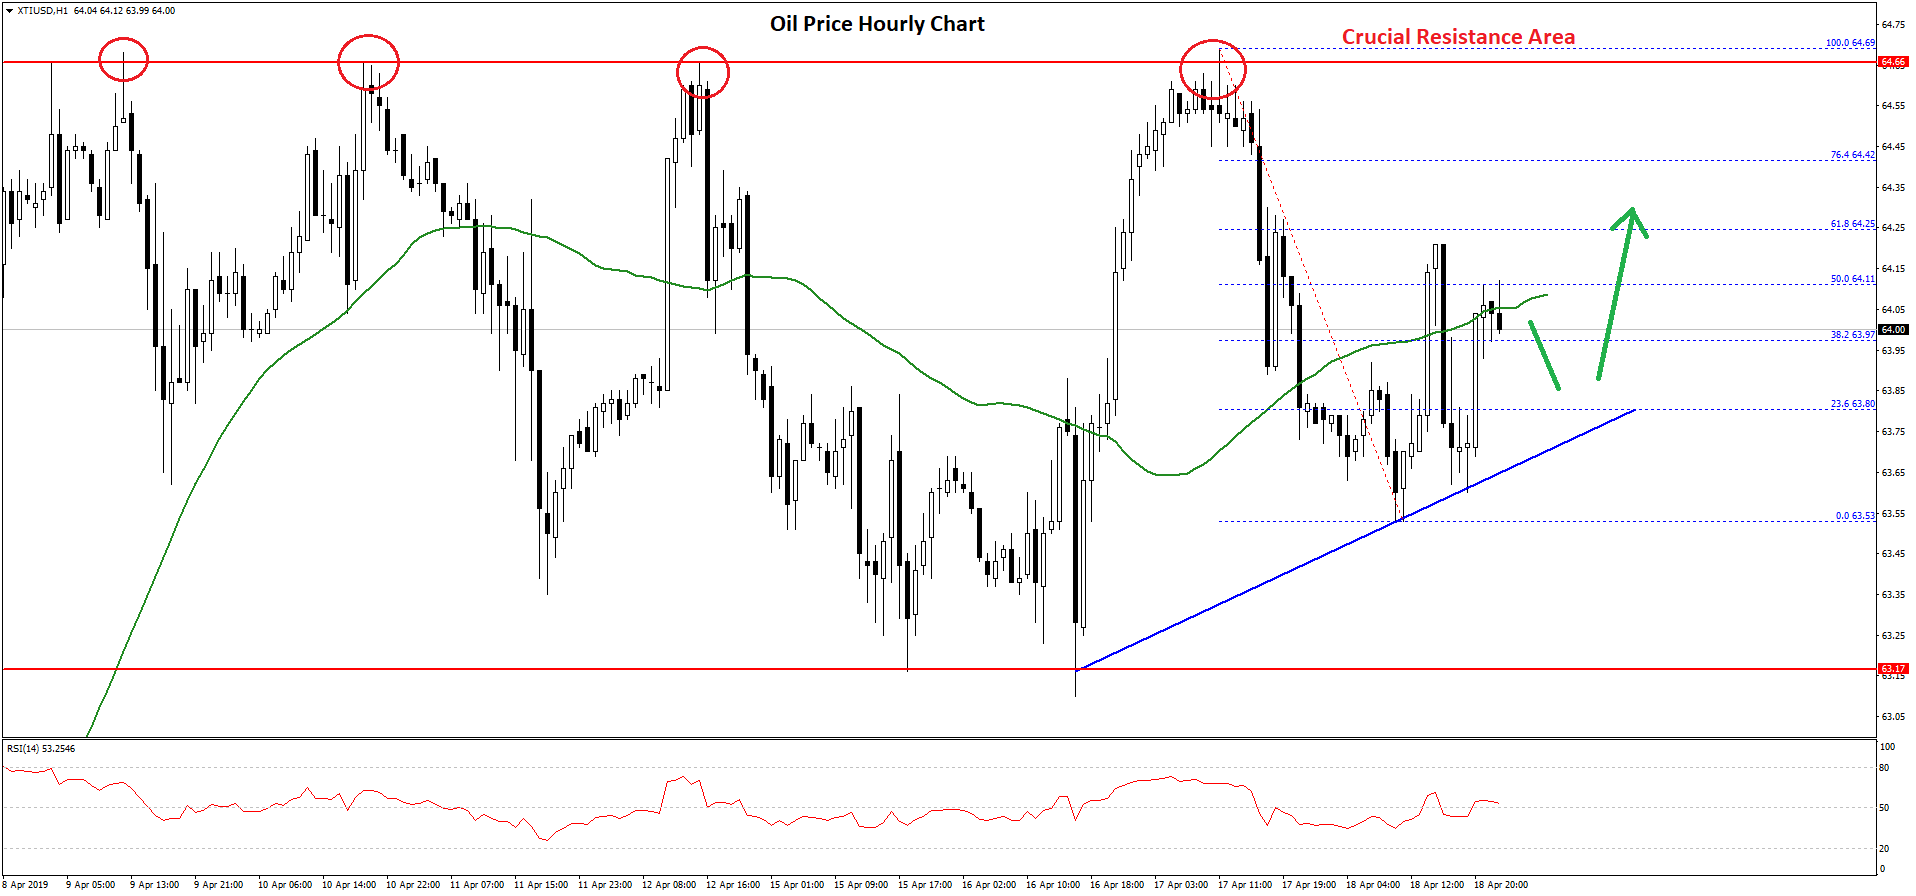
However, the price found support near $63.50 and it is currently following a bullish trend line with support at $63.80 on the hourly chart.
It climbed above the $64.00 level, the 38.2% Fib retracement level of the recent decline from the $64.69 high to $63.53 low, and the 50 hourly simple moving average. However, the price failed to gain strength above the $64.15 level.
The price is currently moving lower and it seems like it could test the trend lien or $63.85. If there is a break below the trend line, the price could decline towards the $63.00 support area.
On the other hand, the price could retest the $64.50 level. The main resistance is near $64.70, which may continue to act as a strong resistance for buyers in the coming days.
Trade over 50 forex markets 24 hours a day with FXOpen. Take advantage of low commissions, deep liquidity, and spreads from 0.0 pips. Open your FXOpen account now or learn more about trading forex with FXOpen.
This article represents the opinion of the Companies operating under the FXOpen brand only. It is not to be construed as an offer, solicitation, or recommendation with respect to products and services provided by the Companies operating under the FXOpen brand, nor is it to be considered financial advice.
Latest from Forex Analysis
Latest articles
AUD/USD Rises Sharply on Inflation News
The Consumer Price Index for Australia was released this morning. According to ForexFactory:
→ CPI in quarterly terms: actual = 1.0%, expected = 0.8%, previous value = 0.6%;
→ CPI in annual terms: actual = 3.5%, expected = 3.4%, previous value = 3.

TSLA Share Price Up About 13% Despite Disappointing Report
Yesterday, TSLA trading closed at USD 144.68 per share, after which Tesla reported its results for the 1st quarter:
→ earnings per share: actual = USD 0.45, forecast = USD 0.49;
→ gross income: actual = USD 21.45 billion, forecast = USD

Market Analysis: Gold Price Corrects Gains While Oil Price Regains Strength
Gold price rallied above $2,400 before correcting lower. Crude oil price is rising and it could climb further higher toward the $85.50 resistance.
Important Takeaways for Gold and Oil Prices Analysis Today
· Gold price rallied significantly above $2,