


FXOpen

Gold price failed to surpass the $1,875 resistance and started a fresh decline. Conversely, crude oil price traded to new multi-month high close to $48.00 level.
Important Takeaways for Gold and Oil
- Gold price started a fresh decline below the $1,870 and $1,850 levels against the US Dollar.
- There is a major contracting triangle forming with resistance near $1,840 on the hourly chart of gold.
- Crude oil price surged above the $46.75 resistance and traded as high as $47.82.
- There was a break above a key declining channel with resistance near $46.20 on the hourly chart of XTI/USD.
Gold Price Technical Analysis
Gold price started a fresh increase above the $1,800 support zone against the US Dollar. The price broke the $1,840 and $1,850 resistance levels to gain bullish momentum.
However, the price struggled to clear the $1,875 resistance. A high was formed near $1,875 on FXOpen and the price started a fresh decline. There was a clear break below the $1,855 support zone and the 50 hourly simple moving average.
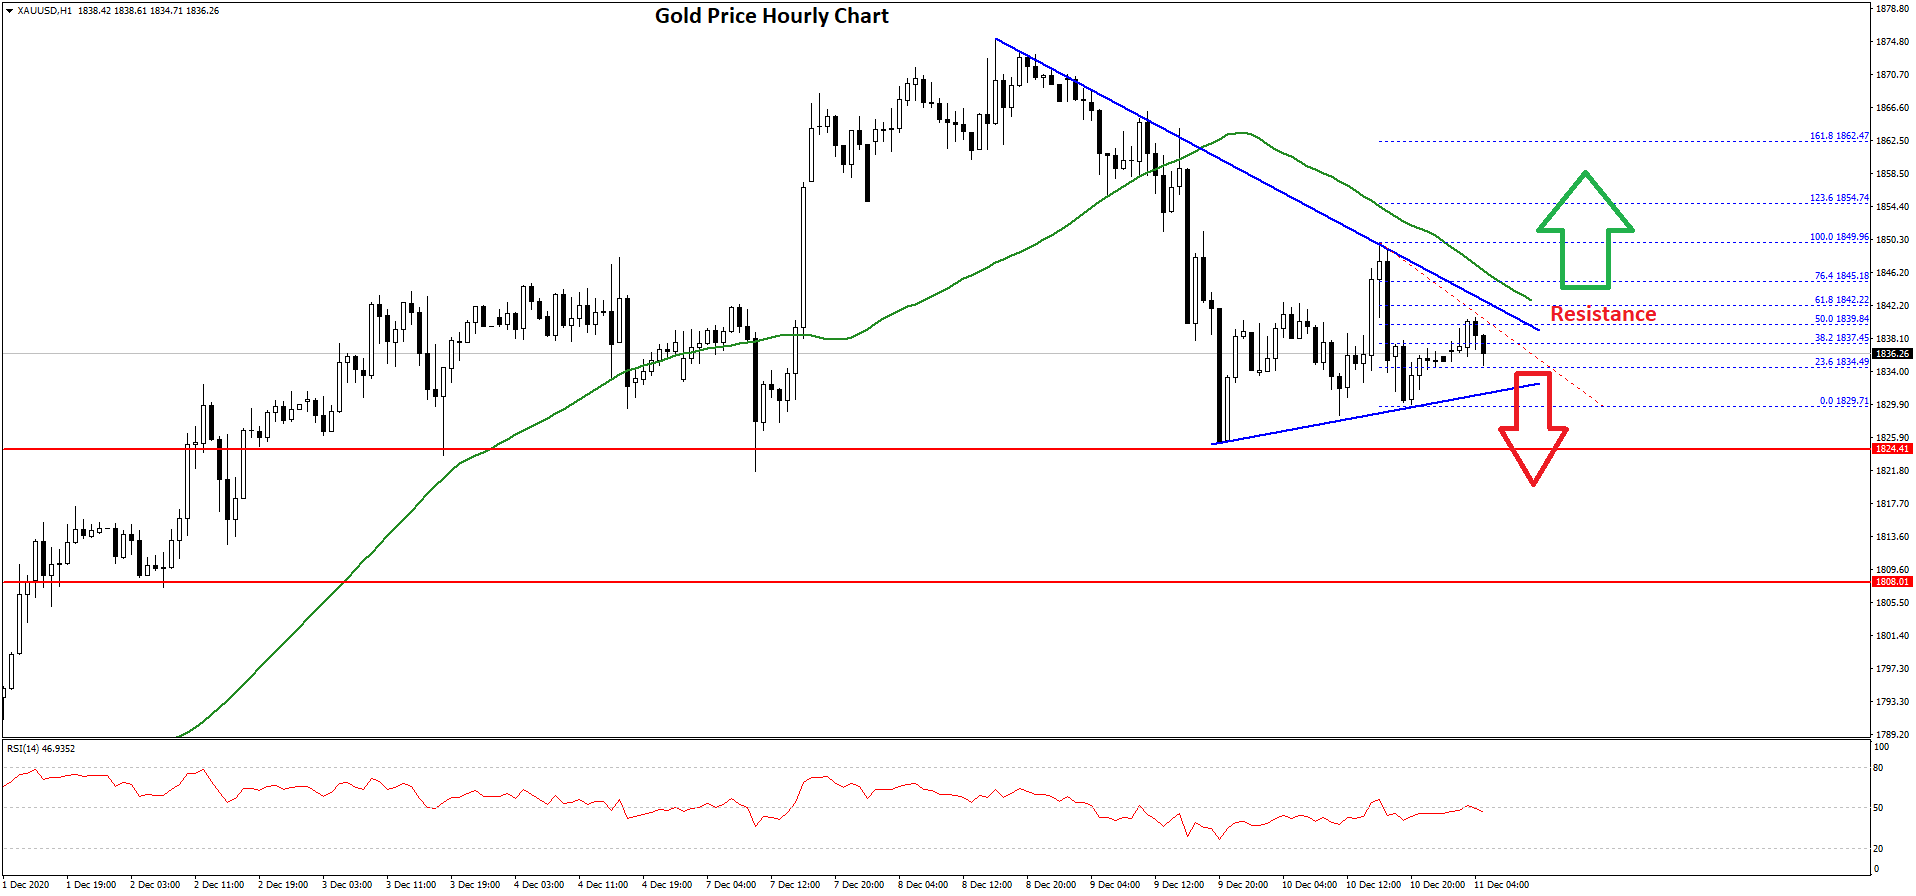
The price even broke the $1,840 level and traded close to $1,825. The price is currently consolidating above $1,825. The recent swing high was near $1,849 before the price declined to $1,829.
It is currently trading above the $1,832 level. There was a break above the 23.6% Fib retracement level of the recent decline from the $1,849 swing high to $1,829 low. On the upside, the price is facing hurdles near the $1,840 level.
Moreover, there is a major contracting triangle forming with resistance near $1,840 on the hourly chart of gold. The triangle resistance is close to the 50% Fib retracement level of the recent decline from the $1,849 swing high to $1,829 low.
A successful close above the triangle resistance, $1,840, and the 50 hourly simple moving average could open the doors for a decent increase in the coming sessions. The next major resistance is near the $1,850 level.
Conversely, the price could continue to move down below the $1,830 and $1,828 levels. The next major support is near $1,810, below which there is a risk of a sharp decline towards $1,780. Any further losses could lead the price towards the $1,750 support zone.
Oil Price Technical Analysis
Crude oil price remained well bid above the $44.00 and $45.00 levels against the US Dollar. The price broke many hurdles near $45.50 to move further into a positive zone.
The bulls remained in action and there was a clear break above the $46.75 resistance. During the rise, there was a break above a key declining channel with resistance near $46.20 on the hourly chart of XTI/USD.
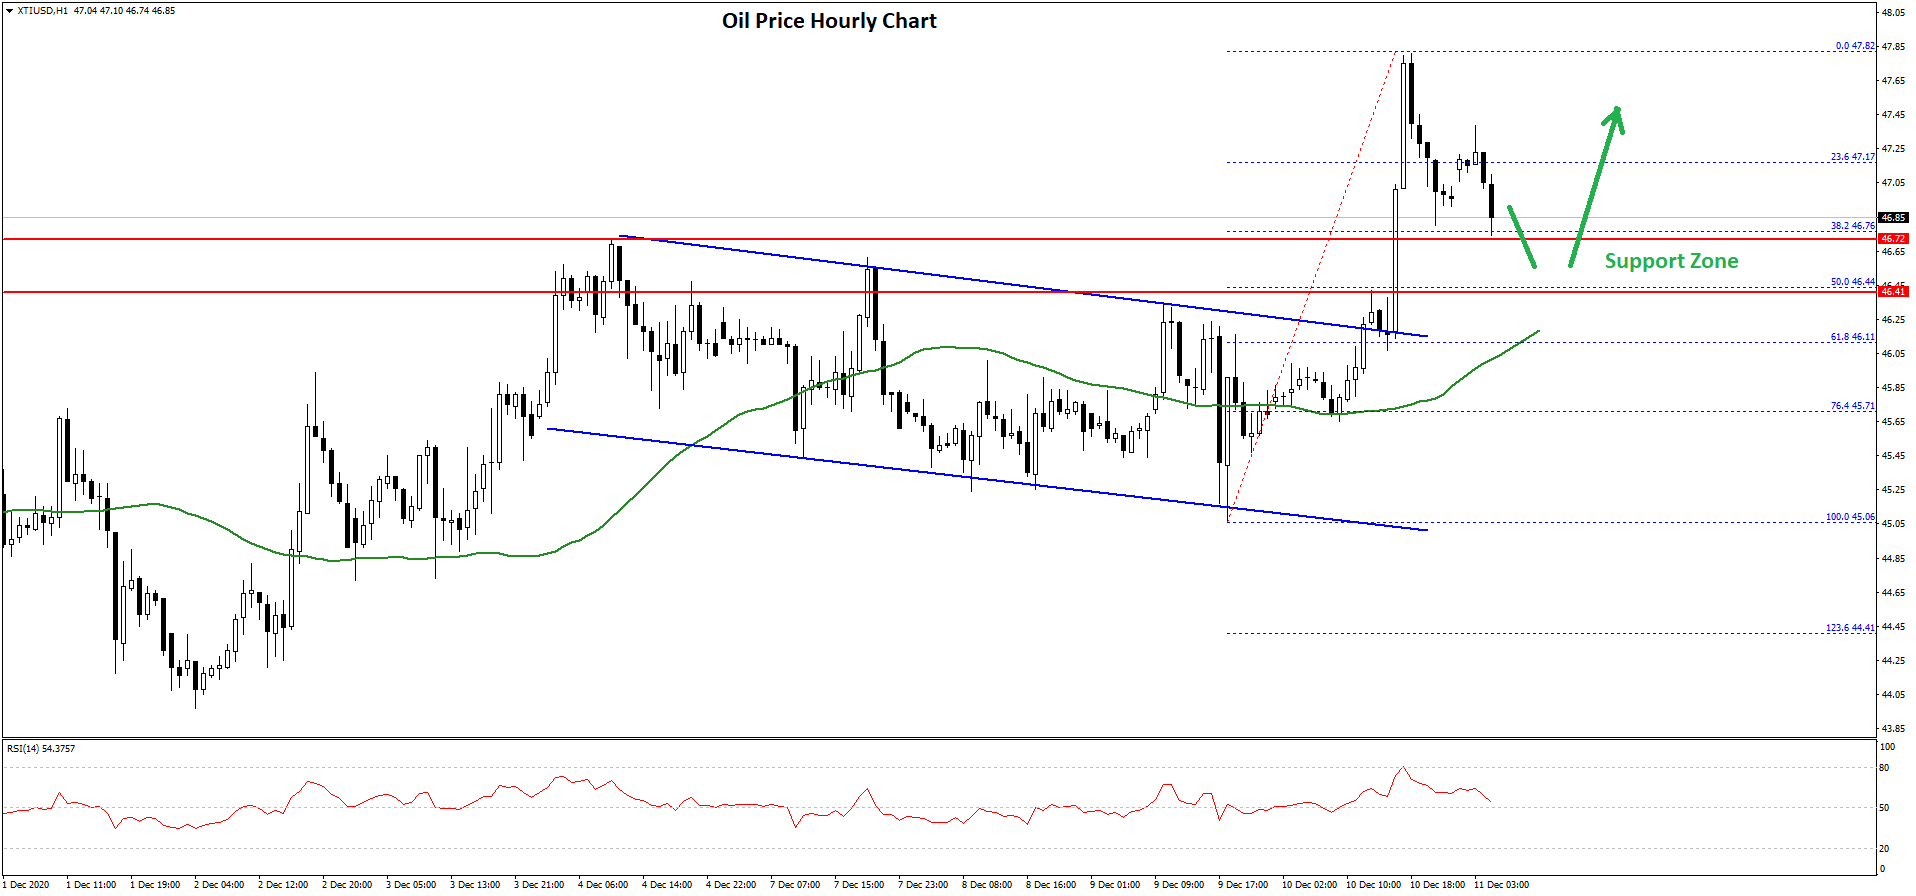
The price even broke the $47.20 resistance and settled well above the 50 hourly simple moving average. It traded close to the $47.85 level and a high is formed near $47.82.
Recently, there was a downside correction below the $47.50 level. There was a break below the 23.6% Fib retracement level of the upward move from the $45.06 swing low to $47.82 high.
On the downside, the previous resistance near $46.75 is acting as a strong support. The next major support is near the $46.50 level or the 50% Fib retracement level of the upward move from the $45.06 swing low to $47.82 high.
On the upside, the price is facing hurdles near the $47.25 level. A close above $47.25 might set the pace for a fresh leg higher towards the $48.00 level.
Trade over 50 forex markets 24 hours a day with FXOpen. Take advantage of low commissions, deep liquidity, and spreads from 0.0 pips. Open your FXOpen account now or learn more about trading forex with FXOpen.
This article represents the opinion of the Companies operating under the FXOpen brand only. It is not to be construed as an offer, solicitation, or recommendation with respect to products and services provided by the Companies operating under the FXOpen brand, nor is it to be considered financial advice.
Stay ahead of the market!
Subscribe now to our mailing list and receive the latest market news and insights delivered directly to your inbox.


Latest articles


XBR/USD Chart Analysis: Price Rebounds from a Seven-Week Low
On 1 December, we outlined a descending channel on the XBR/USD chart and noted that the bearish trend was driven by fading geopolitical risks. Indeed, hopes for an end to the war in Ukraine—along with the possibility of

Silver Price Hits Historic Record Around $64
On 27 November, we suggested that silver was preparing to challenge its all-time high. Since then (marked with the orange arrow), XAG/USD has risen by roughly 18%, breaking above the psychological $60-per-ounce threshold for the first time in history.