


Gold Price Nosedives While Crude Oil Price Extends Rally
FXOpen

Gold price started a major decline and traded below the $1,785 support. Crude oil price is rising and it is broke the $72.00 resistance zone.
Important Takeaways for Gold and Oil
· Gold price started a major decline from the $1,800 resistance zone against the US Dollar.
· There was a break below a short-term bullish trend line with support near $1,793 on the hourly chart of gold.
· Crude oil price started a fresh increase from the $70.00 support zone.
· There is a major bullish trend line forming with support near $72.00 on the hourly chart of XTI/USD.
Gold Price Technical Analysis
Gold price failed to stay above the $1,800 support zone against the US Dollar. As a result, the price started a fresh decline below the $1,800 and $1,790 levels.
The price gained pace after it broke the $1,785 support and the 50 hourly simple moving average. There was also a break below a short-term bullish trend line with support near $1,793 on the hourly chart of gold.
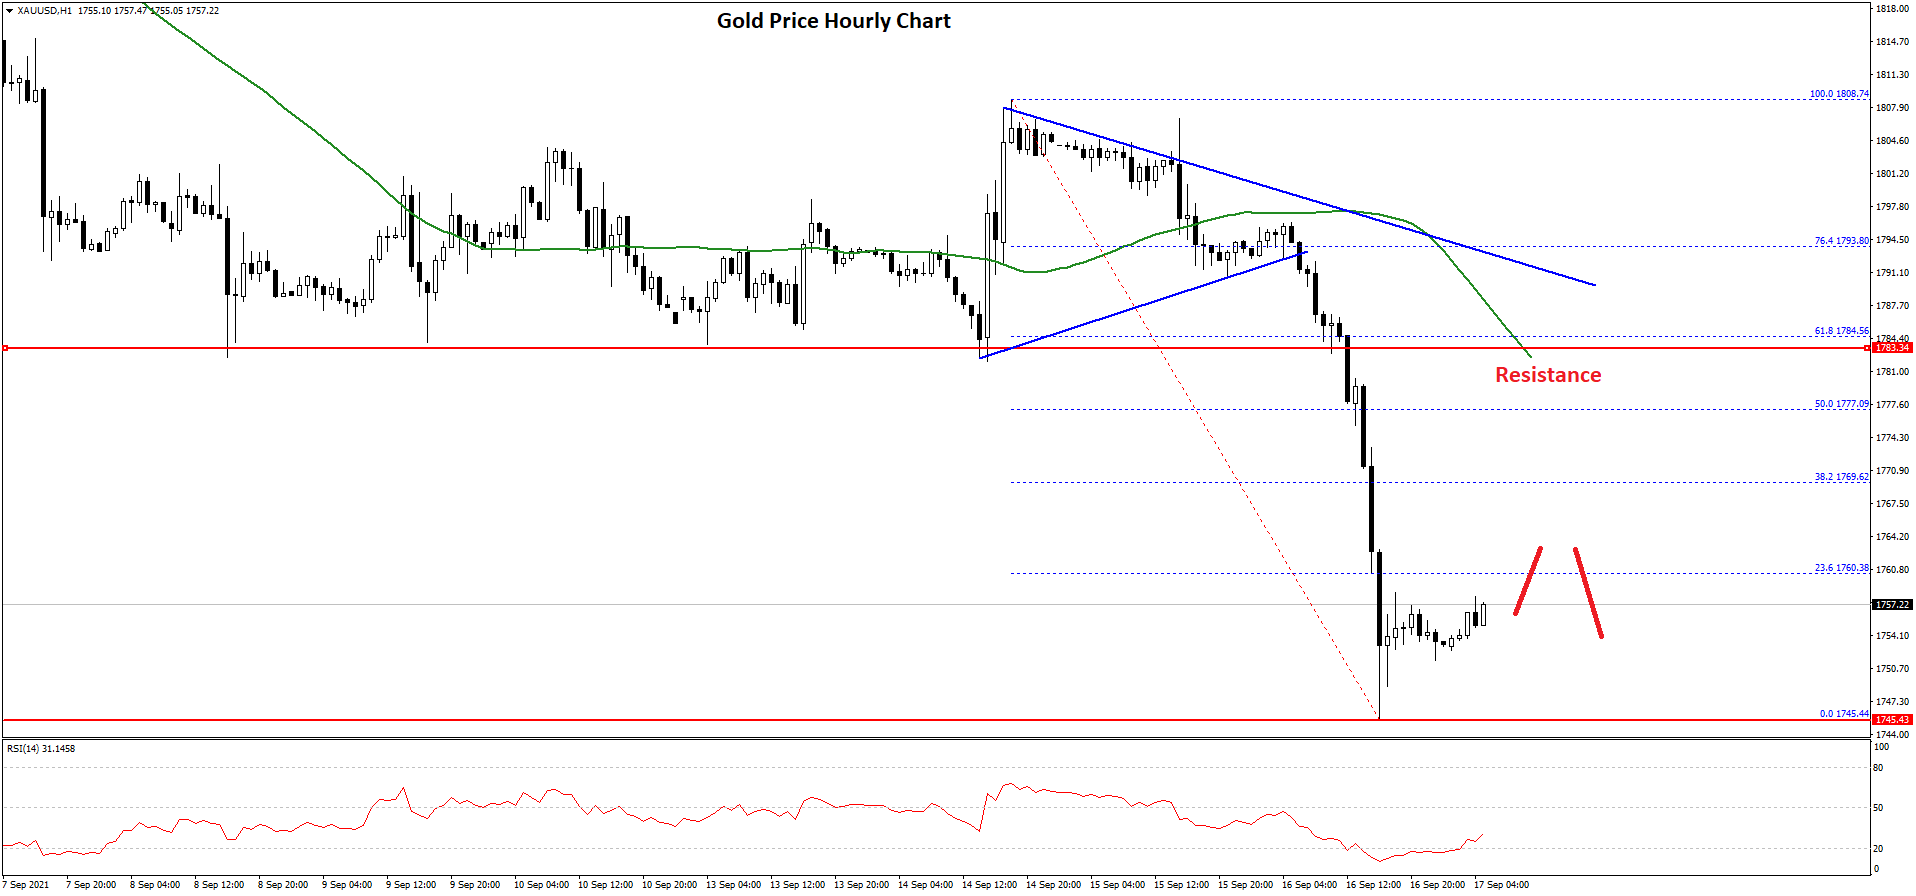
The price declined below the $1,750 level and traded as low as $1,745 on FXOpen. It is now correcting higher and trading above $1,750.
An immediate resistance is near the $1,760 level. It is near the 23.6% Fib retracement level of the recent decline from the $1,808 high to $1,745 swing low. The first major resistance is near the $1,775 level.
The main resistance is near the $1,785 level and the 50 hourly simple moving average. A close above the $1,785 levels could open the doors for a steady increase towards $1,800. The next major resistance sits near the $1,810 level.
Conversely, the price might resume its decline below the $1,750 level. The first major support is near the $1,745 level. A downside break below the $1,745 support zone may possibly spark a sharp decline. In the stated case, the price could test the $1,720 support.
Oil Price Technical Analysis
Crude oil price started a major increase from the $68.50 support zone against the US Dollar. The price broke the $70.00 resistance zone to move into a positive zone.
The price even cleared the $71.50 level and settled above the 50 hourly simple moving average. A high was formed near $72.85 before the price corrected lower. It corrected a few points below the $72.00 level.
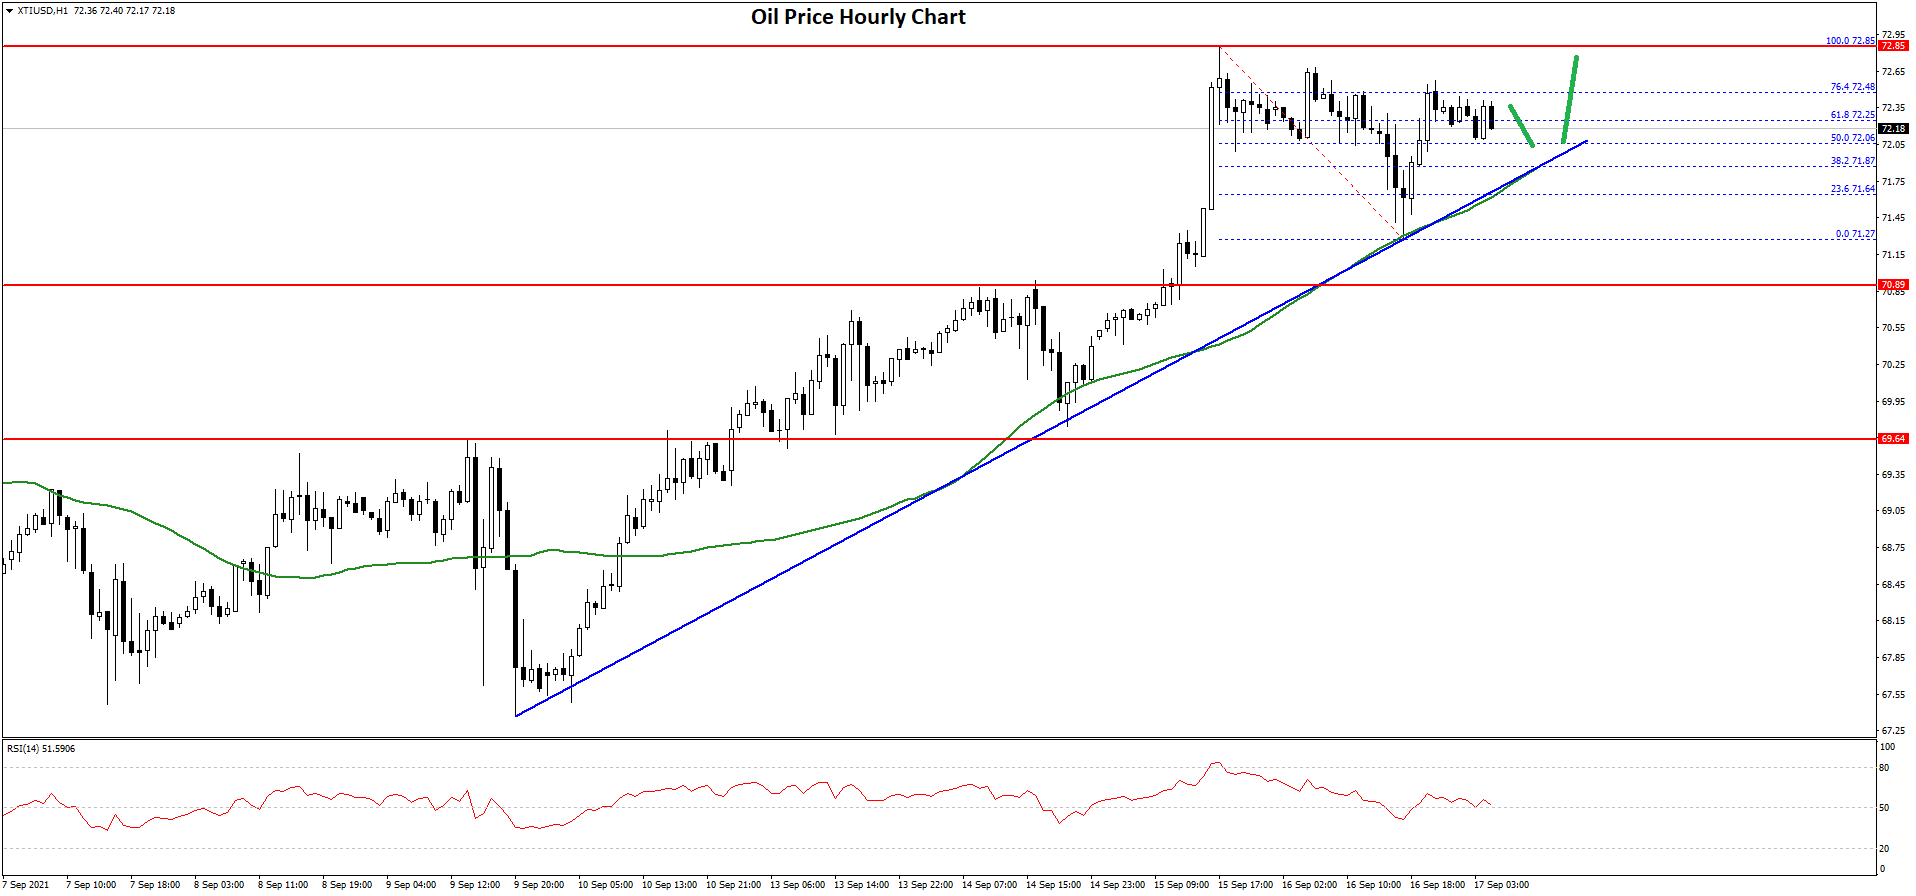
However, downsides were limited below $71.20. A low was formed near $71.27 and the price is now rising. It broke the 23.6% Fib retracement level of the recent decline from the $72.85 high to $71.27 low.
It even climbed above the $72.20 level. It seems like the price is now facing resistance near $72.50. The 76.4% Fib retracement level of the recent decline from the $72.85 high to $71.27 low is also near the $72.50 level.
The next key resistance is near the $72.80 level, above which the price might rise towards the $74.00 level. An initial support on the downside is near the $72.00 level.
There is also a major bullish trend line forming with support near $72.00 on the hourly chart of XTI/USD. If there is a downside break, the price could extend its decline towards the $70.00 level in the coming sessions.
This forecast represents FXOpen Markets Limited opinion only, it should not be construed as an offer, invitation or recommendation in respect to FXOpen Markets Limited products and services or as financial advice.
This article represents the opinion of the Companies operating under the FXOpen brand only. It is not to be construed as an offer, solicitation, or recommendation with respect to products and services provided by the Companies operating under the FXOpen brand, nor is it to be considered financial advice.
Stay ahead of the market!
Subscribe now to our mailing list and receive the latest market news and insights delivered directly to your inbox.

Latest articles

AUD/CAD: Pair Remains Range-Bound Amid Interest Rate Divergence
The key macroeconomic factor for AUD/CAD remains the divergence in monetary policy between the two central banks. After three consecutive rate hikes since the beginning of the year, the Reserve Bank of Australia left its cash rate unchanged at

Brent Crude Oil Analysis: Stabilisation or Simply a Pause?
Over the past few weeks, financial markets have been more focused than ever on developments surrounding the Strait of Hormuz — a critical waterway at the centre of ongoing US-Iran negotiations. The back-and-forth of diplomatic headlines has injected significant volatility into

Gold Analysis: Could XAU/USD Bounce From the Crucial $4,000 Level?
The year 2026 has so far been an unforgiving one for gold. XAU/USD is down approximately 7% since the start of the year, and roughly 28% from the late-January peak — a significant correction, though a physiologically natural one following