


FXOpen

Gold price is trading in a positive zone above the $1,585 resistance area and it could rise further. Conversely, crude oil price is trading in a range and it could correct above $25.00.
Important Takeaways for Gold and Oil
- Gold price gained pace recently and traded above the $1,600 resistance against the US Dollar.
- There is a key bullish trend line forming with support near $1,584 on the hourly chart of gold.
- Crude oil price is still trading below the main $25.00 and $25.70 resistance levels.
- There is a major bearish trend line forming with resistance near $24.35 on the hourly chart of XTI/USD.
Gold Price Technical Analysis
In the past few days, gold price remained in a positive zone above the $1,550 zone against the US Dollar. It traded above the $1,565 and $1,580 resistance levels to start a decent upward move.
Moreover, there was a close above the $1,585 resistance and the 50 hourly simple moving average. Finally, the price climbed above the $1,600 resistance area and traded as high as $1,629 on FXOpen.
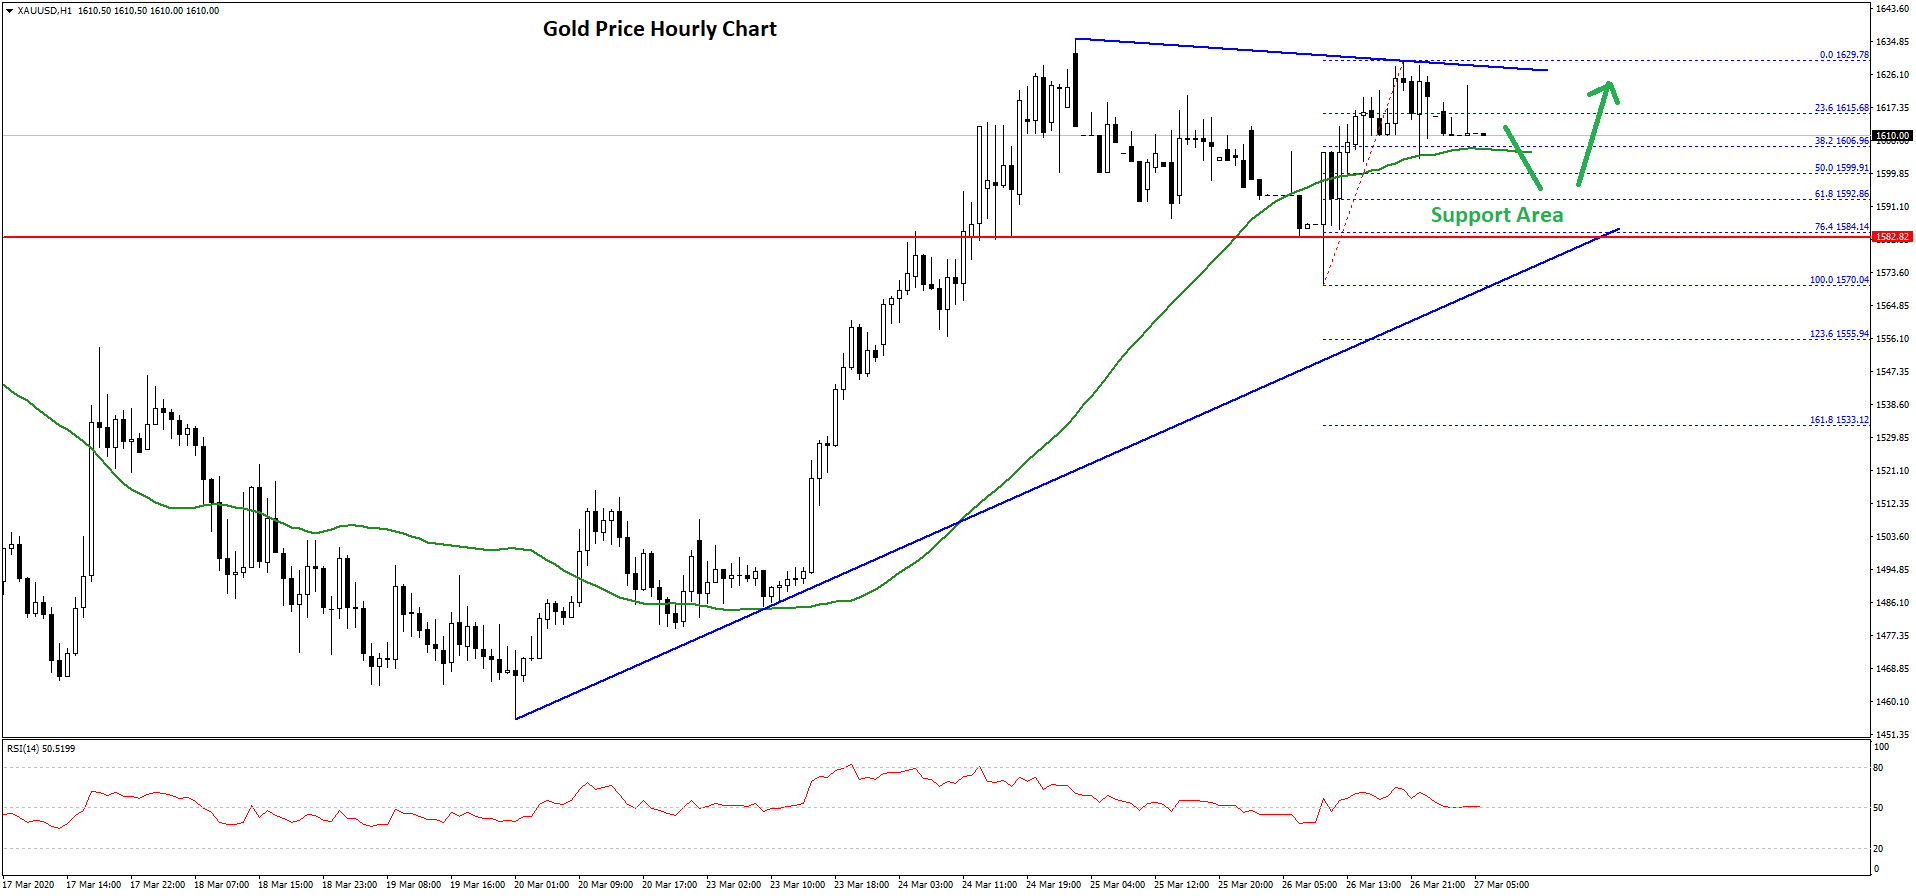
The price is currently correcting lower below $1,620. There was a break below the 23.6% Fib retracement level of the recent rise from the $1,570 low to $1,629 high.
On the downside, an initial support is near the $1,606 level and the 50 hourly simple moving average. The next major support is near the $1,600 level. It is close to the 50% Fib retracement level of the recent rise from the $1,570 low to $1,629 high.
There is also a key bullish trend line forming with support near $1,584 on the hourly chart of gold. Clearly, the $1,584 area is an important support zone for the bulls in the near term.
If there is a downside break below the $1,585 and $1,584 support levels, there could be a nasty decline. The next major support is near the $1,555 level, below which there is a risk of more downsides towards $1,530.
Conversely, the price may perhaps rise above the $1,620 and $1,625 resistance levels. Any further gains could lead the price towards the $1,650 level in the near term.
Oil Price Technical Analysis
Recently, crude oil price started an upside correction from the $21.24 low against the US Dollar. The price was able to recover above the $22.00 and $22.50 resistance levels.
Moreover, it surpassed the $25.00 level and the 50 hourly simple moving average. However, the price failed to continue higher above the $25.70 level.
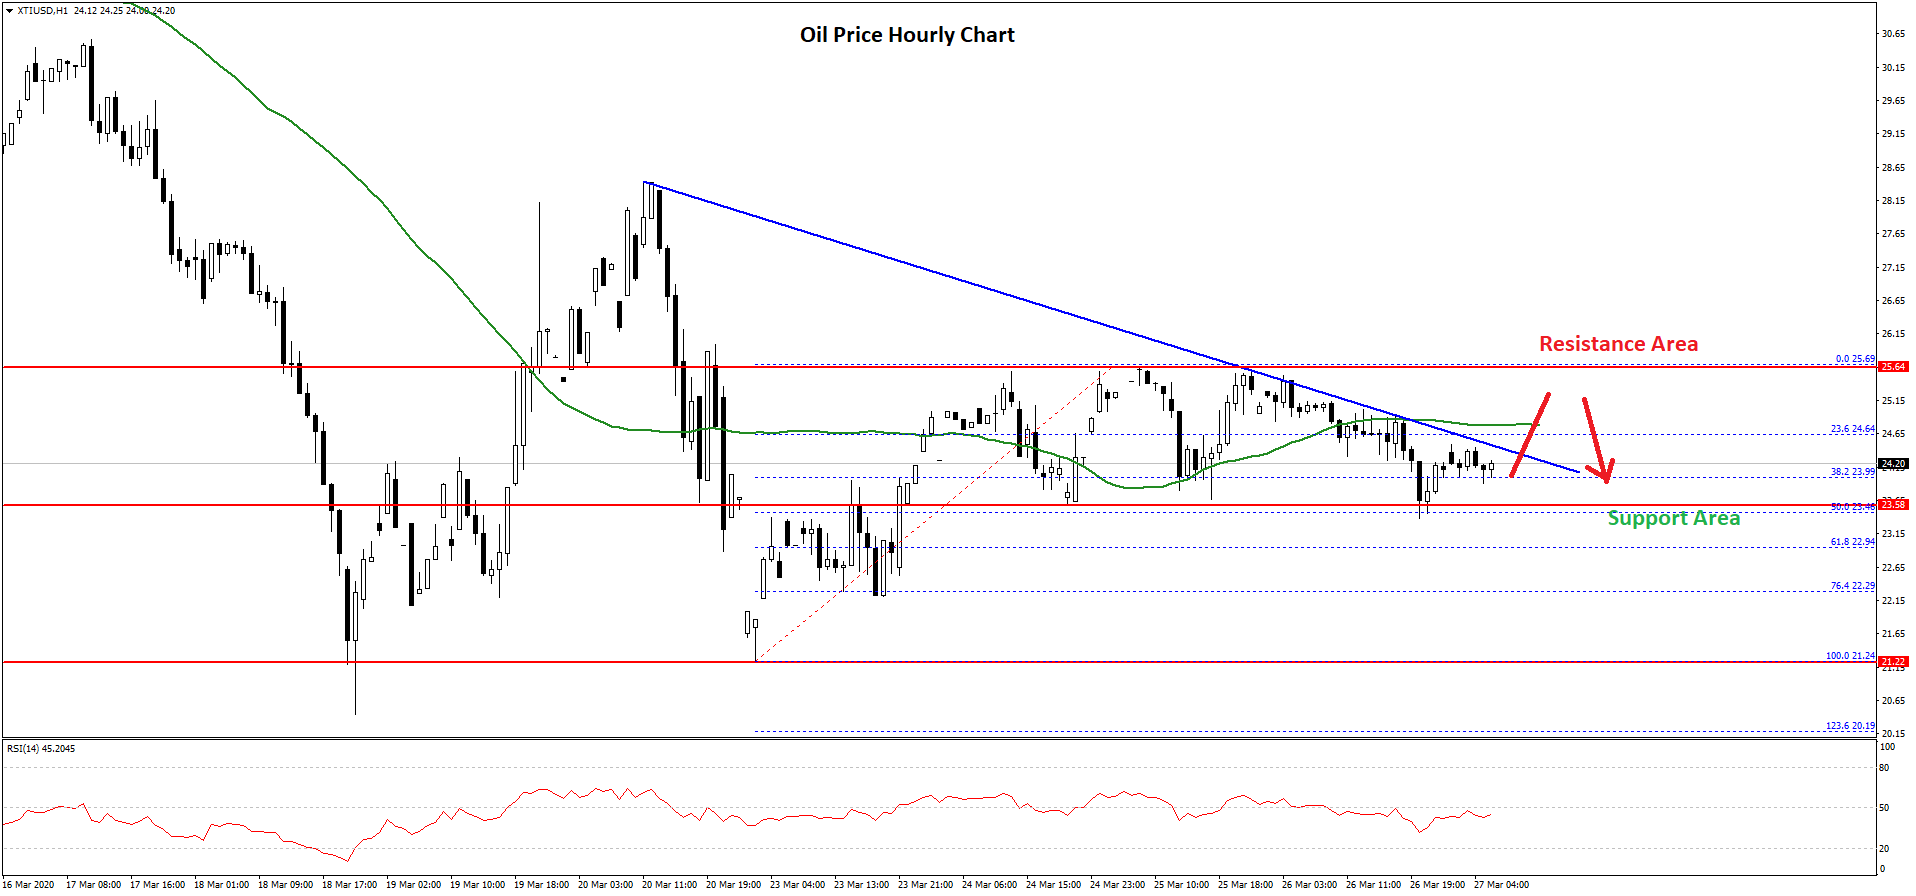
A swing high is formed near the $25.69 level and the price is currently correcting lower. It broke the 23.6% Fib retracement level of the upward move from the $21.24 low to $25.69 high.
On the downside, the $23.60 area is acting as a decent support. The 50% Fib retracement level of the upward move from the $21.24 low to $25.69 high is also near the $23.60 area.
If the price fails to stay above the $23.60 support, it could decline back towards the $22.50 and $22.00 support levels.
Conversely, the price could make another attempt to rise above $25.00 and $25.70. There is also a major bearish trend line forming with resistance near $24.35 on the hourly chart of XTI/USD.
Therefore, a clear break above the $24.40, $25.00 and $25.70 resistance levels is needed for a strong rise.
Trade over 50 forex markets 24 hours a day with FXOpen. Take advantage of low commissions, deep liquidity, and spreads from 0.0 pips. Open your FXOpen account now or learn more about trading forex with FXOpen.
This article represents the opinion of the Companies operating under the FXOpen brand only. It is not to be construed as an offer, solicitation, or recommendation with respect to products and services provided by the Companies operating under the FXOpen brand, nor is it to be considered financial advice.
Latest from Forex Analysis
Latest articles

Weekly Market Wrap With Gary Thomson: UK100, USD, GOLD, OIL
Get the latest scoop on the week's hottest headlines, all in one convenient video. Join Gary Thomson, the COO of FXOpen UK, as he breaks down the most significant news reports and shares his expert insights.
- UK100 Share Index Rises

What Is a Darvas Box Theory and How Does It Work in Trading?
The Darvas Box Theory, pioneered by Nicolas Darvas in the 1950s, has transcended its stock market origins to become a valuable tool for forex traders. This method leverages specific price movements and patterns, known as the Darvas Box, to track

NFLX Stock Price Falls Despite Subscriber Growth
Yesterday, after the close of the main trading session on the stock market, Netflix reported to investors for the 1st quarter of 2024.
The report turned out better than expected:
→ earnings per share: actual = USD 5.28, forecast = USD 4.