


FXOpen

Gold price found support near the $1,455 level and it is currently consolidating losses. Conversely, crude oil price is recovering and it is now trading above the $25.00 resistance.
Important Takeaways for Gold and Oil
- Gold price declined heavily before it found support near the $1,455 level against the US Dollar.
- The bulls are currently attempting a break above a connecting bearish trend line at $1,462 on the hourly chart of gold.
- Crude oil price started a decent upside correction after it fell close to the $20.00 level.
- There was a break above a major bearish trend line with resistance near $24.85 on the hourly chart of XTI/USD.
Gold Price Technical Analysis
In the past few days, gold price followed a bearish path from well above the $1,580 level against the US Dollar. It broke a couple of key supports near the $1,550 to move further into a bearish zone.
Moreover, there was a close below the $1,500 level and the 50 hourly simple moving average. Finally, it traded as low as $1,455 on FXOpen and it is now consolidating losses.

It seems like there is likely a double bottom pattern forming near the $1,455 level. The price is trading above the 23.6% Fib retracement level of the recent decline from the $1,553 high to $1,455 low.
Moreover, the bulls are currently attempting a break above a connecting bearish trend line at $1,462 on the hourly chart of gold. If they succeed, the price might start a decent recovery towards the $1,500 resistance level.
The 50 hourly simple moving average is close to the $1,500 level to act as a key resistance. The 50% Fib retracement level of the recent decline from the $1,553 high to $1,455 low is also near the $1,505 level.
Therefore, the price is likely to face a strong resistance near $1,500 and $1,505. A successful close above the $1,500 and $1,505 levels might start a strong rise.
Conversely, the price could start another decline and it might even trade below the $1,455 and $1,450 support levels in the near term.
Oil Price Technical Analysis
Recently, crude oil price declined heavily below the $35.00 and $30.00 support levels against the US Dollar. The bears were able to lead the price below the $25.00 support level.
It traded close to the $20.00 support and a new yearly low is formed near $20.44. The price is currently correcting higher and trading above the $22.00 resistance.
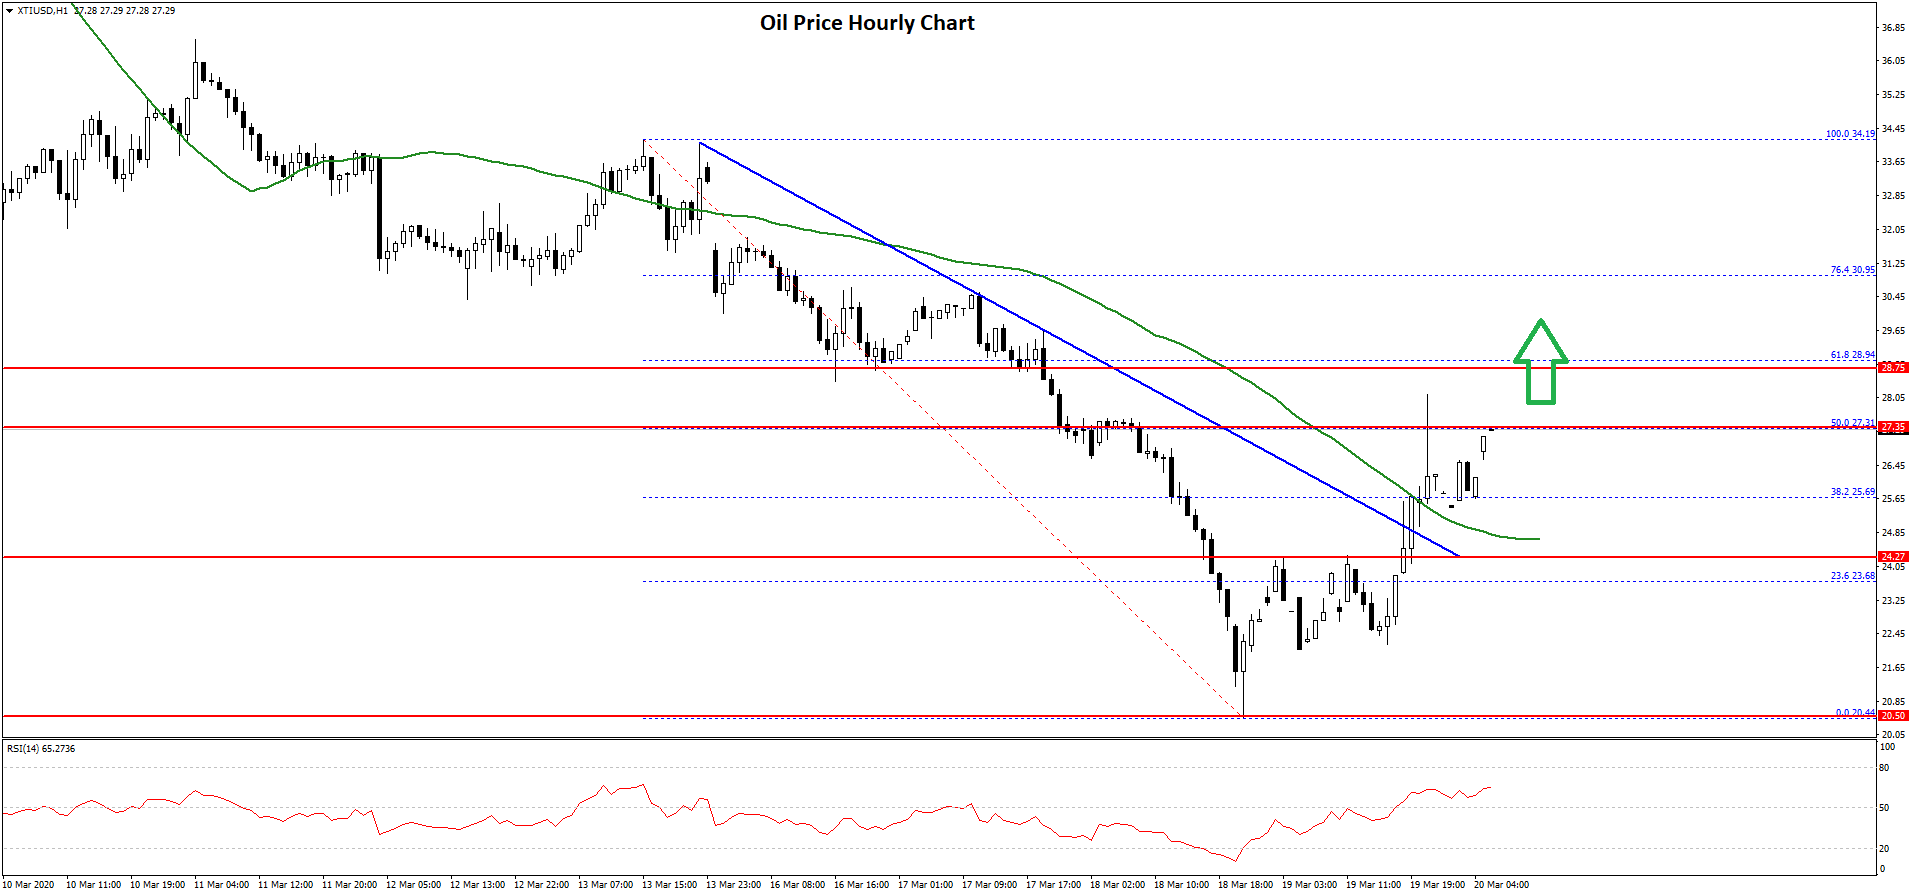
During the rise, there was a break above a major bearish trend line with resistance near $24.85 on the hourly chart of XTI/USD. The price is now trading above the $25.00 resistance and the 50 hourly simple moving average.
It is now testing the 50% Fib retracement level of the downward move from the $34.19 high to $20.44 low. If there is an upside break above $27.30, the next hurdle is near the $28.95 level.
Besides, the 61.8% Fib retracement level of the downward move from the $34.19 high to $20.44 low is near the $28.95 level. Therefore, the price must surpass the $27.30 and $29.00 levels to climb further higher.
If not, it could start a fresh decline below $26.00. The first support for oil price is near the $25.00 level, below which it could decline towards the $22.00 level.
Trade over 50 forex markets 24 hours a day with FXOpen. Take advantage of low commissions, deep liquidity, and spreads from 0.0 pips. Open your FXOpen account now or learn more about trading forex with FXOpen.
This article represents the opinion of the Companies operating under the FXOpen brand only. It is not to be construed as an offer, solicitation, or recommendation with respect to products and services provided by the Companies operating under the FXOpen brand, nor is it to be considered financial advice.
Latest from Forex Analysis
Latest articles

Germany's DAX 40 Index Flying High Despite Pessimistic National Outlook
For a number of years now, there has been a lot of discourse over the current situation and the future of the German domestic economy.
From both inside Germany and globally, analysts, government officials, and corporate leaders have demonstrated a
Volatility in the Pound Is Rising, the Euro is Consolidating
GBP/USD
At the end of last week, the British currency fell sharply, testing a significant support level at 1.2300. The resumption of the downward trend for the pair became possible after some statements by British officials:
- On Wednesday,

The Price of Gold XAU/USD Shows Strongest Fall in Almost 2 Years
On Monday, the price of gold fell from USD 2,386 to USD 2,333 per ounce — this is the strongest drop in one day in almost 2 years, according to Bloomberg. On Tuesday morning in the Asian session, the